

Houlton 2016) coincided with the increasing contribution of atmospheric reactive N
to acid deposition in China (Figs. 8.2 and 8.6). Consistent with the increase of
TIN/SO 4
2À in throughfall, the TIN/SO 4
2À in stream water increased from 2001 to
2013 at Tieshanping site (Fig. 8.6). The acidifying potential of atmospheric N
deposition was indicated by NO 3
À (result from NO 3
À deposition and nitrification
of deposited NH 4
+ ) concentration of stream water. During 1988–1997, the concentration of NO 3
À increased significantly (with a rate of 4.9 μeq L
À1 year
À1 , p < 0.01)
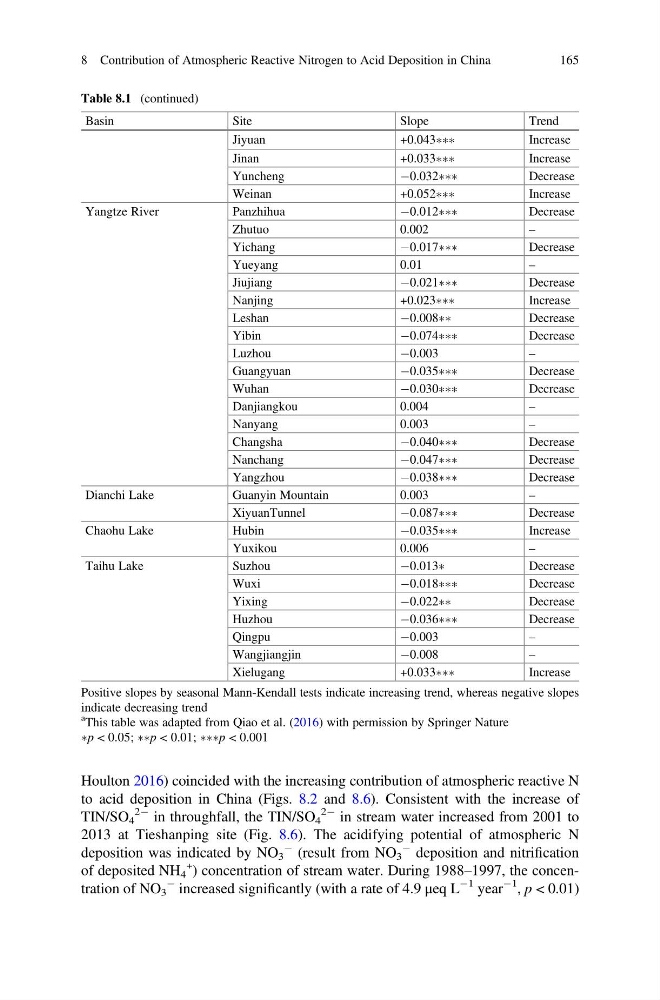
Table 8.1 (continued)
Basin
Site
Slope
Trend
Jiyuan
+0.043ÃÃÃ
Increase
Jinan
+0.033ÃÃÃ
Increase
Yuncheng
À0.032ÃÃÃ
Decrease
Weinan
+0.052ÃÃÃ
Increase
Yangtze River
Panzhihua
À0.012ÃÃÃ
Decrease
Zhutuo
0.002
–
Yichang
À0.017ÃÃÃ
Decrease
Yueyang
0.01
–
Jiujiang
À0.021ÃÃÃ
Decrease
Nanjing
+0.023ÃÃÃ
Increase
Leshan
À0.008ÃÃ
Decrease
Yibin
À0.074ÃÃÃ
Decrease
Luzhou
À0.003
–
Guangyuan
À0.035ÃÃÃ
Decrease
Wuhan
À0.030ÃÃÃ
Decrease
Danjiangkou
0.004
–
Nanyang
0.003
–
Changsha
À0.040ÃÃÃ
Decrease
Nanchang
À0.047ÃÃÃ
Decrease
Yangzhou
À0.038ÃÃÃ
Decrease
Dianchi Lake
Guanyin Mountain
0.003
–
XiyuanTunnel
À0.087ÃÃÃ
Decrease
Chaohu Lake
Hubin
À0.035ÃÃÃ
Increase
Yuxikou
0.006
–
Taihu Lake
Suzhou
À0.013Ã
Decrease
Wuxi
À0.018ÃÃÃ
Decrease
Yixing
À0.022ÃÃ
Decrease
Huzhou
À0.036ÃÃÃ
Decrease
Qingpu
À0.003
–
Wangjiangjin
À0.008
–
Xielugang
+0.033ÃÃÃ
Increase
Positive slopes by seasonal Mann-Kendall tests indicate increasing trend, whereas negative slopes
indicate decreasing trend
a This table was adapted from Qiao et al. (2016) with permission by Springer Nature
Ãp < 0.05; ÃÃp < 0.01; ÃÃÃp < 0.001
8 Contribution of Atmospheric Reactive Nitrogen to Acid Deposition in China
165
to acid deposition in China (Figs. 8.2 and 8.6). Consistent with the increase of
TIN/SO 4
2À in throughfall, the TIN/SO 4
2À in stream water increased from 2001 to
2013 at Tieshanping site (Fig. 8.6). The acidifying potential of atmospheric N
deposition was indicated by NO 3
À (result from NO 3
À deposition and nitrification
of deposited NH 4
+ ) concentration of stream water. During 1988–1997, the concentration of NO 3
À increased significantly (with a rate of 4.9 μeq L
À1 year
À1 , p < 0.01)
Table 8.1 (continued)
Basin
Site
Slope
Trend
Jiyuan
+0.043ÃÃÃ
Increase
Jinan
+0.033ÃÃÃ
Increase
Yuncheng
À0.032ÃÃÃ
Decrease
Weinan
+0.052ÃÃÃ
Increase
Yangtze River
Panzhihua
À0.012ÃÃÃ
Decrease
Zhutuo
0.002
–
Yichang
À0.017ÃÃÃ
Decrease
Yueyang
0.01
–
Jiujiang
À0.021ÃÃÃ
Decrease
Nanjing
+0.023ÃÃÃ
Increase
Leshan
À0.008ÃÃ
Decrease
Yibin
À0.074ÃÃÃ
Decrease
Luzhou
À0.003
–
Guangyuan
À0.035ÃÃÃ
Decrease
Wuhan
À0.030ÃÃÃ
Decrease
Danjiangkou
0.004
–
Nanyang
0.003
–
Changsha
À0.040ÃÃÃ
Decrease
Nanchang
À0.047ÃÃÃ
Decrease
Yangzhou
À0.038ÃÃÃ
Decrease
Dianchi Lake
Guanyin Mountain
0.003
–
XiyuanTunnel
À0.087ÃÃÃ
Decrease
Chaohu Lake
Hubin
À0.035ÃÃÃ
Increase
Yuxikou
0.006
–
Taihu Lake
Suzhou
À0.013Ã
Decrease
Wuxi
À0.018ÃÃÃ
Decrease
Yixing
À0.022ÃÃ
Decrease
Huzhou
À0.036ÃÃÃ
Decrease
Qingpu
À0.003
–
Wangjiangjin
À0.008
–
Xielugang
+0.033ÃÃÃ
Increase
Positive slopes by seasonal Mann-Kendall tests indicate increasing trend, whereas negative slopes
indicate decreasing trend
a This table was adapted from Qiao et al. (2016) with permission by Springer Nature
Ãp < 0.05; ÃÃp < 0.01; ÃÃÃp < 0.001
8 Contribution of Atmospheric Reactive Nitrogen to Acid Deposition in China
165