

region with most severe acid rain moved eastwards (Tang et al. 2010). The increase
of precipitation pH mainly attributed to the decline of SO 4
2À deposition.
8.3 N Deposition Impacts on Surface Water Acidification
Surface water in the regions with high acid deposition tends to be acidified,
manifesting as a decline of pH and acid neutralization capacity (ANC) but an
increase of concentrations of NO 3
À , SO 4
2À , and some metal ions (i.e., Al
3+ ). The
pH is an important parameter for indicating degree of acidification and its biological
effects (Matsubara et al. 2009). The ANC of waters is another important parameter,
which was widely used as an indicator for the sensitivity of surface water to
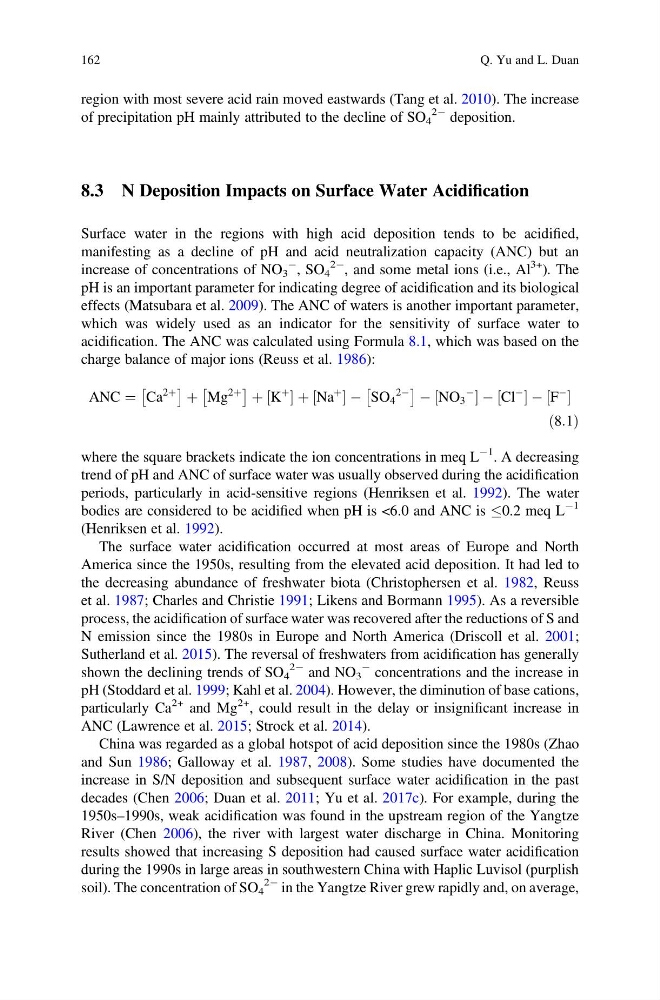
acidification. The ANC was calculated using Formula 8.1, which was based on the
charge balance of major ions (Reuss et al. 1986):
ANC ¼ Ca
2þ
Â
à þ Mg
2þ
Â
à þ K
þ
½ þ Na
þ
½
À SO 4
2À
Â
à À NO 3
À
½
À Cl
À
½
À F
À
½
ð8:1Þ
where the square brackets indicate the ion concentrations in meq L
À1 . A decreasing
trend of pH and ANC of surface water was usually observed during the acidification
periods, particularly in acid-sensitive regions (Henriksen et al. 1992). The water
bodies are considered to be acidified when pH is <6.0 and ANC is 0.2 meq L
À1
(Henriksen et al. 1992).
The surface water acidification occurred at most areas of Europe and North
America since the 1950s, resulting from the elevated acid deposition. It had led to
the decreasing abundance of freshwater biota (Christophersen et al. 1982, Reuss
et al. 1987; Charles and Christie 1991; Likens and Bormann 1995). As a reversible
process, the acidification of surface water was recovered after the reductions of S and
N emission since the 1980s in Europe and North America (Driscoll et al. 2001;
Sutherland et al. 2015). The reversal of freshwaters from acidification has generally
shown the declining trends of SO 4
2À and NO 3
À concentrations and the increase in
pH (Stoddard et al. 1999; Kahl et al. 2004). However, the diminution of base cations,
particularly Ca
2+ and Mg
2+ , could result in the delay or insignificant increase in
ANC (Lawrence et al. 2015; Strock et al. 2014).
China was regarded as a global hotspot of acid deposition since the 1980s (Zhao
and Sun 1986; Galloway et al. 1987, 2008). Some studies have documented the
increase in S/N deposition and subsequent surface water acidification in the past
decades (Chen 2006; Duan et al. 2011; Yu et al. 2017c). For example, during the
1950s–1990s, weak acidification was found in the upstream region of the Yangtze
River (Chen 2006), the river with largest water discharge in China. Monitoring
results showed that increasing S deposition had caused surface water acidification
during the 1990s in large areas in southwestern China with Haplic Luvisol (purplish
soil). The concentration of SO 4
2À in the Yangtze River grew rapidly and, on average,
162
Q. Yu and L. Duan
of precipitation pH mainly attributed to the decline of SO 4
2À deposition.
8.3 N Deposition Impacts on Surface Water Acidification
Surface water in the regions with high acid deposition tends to be acidified,
manifesting as a decline of pH and acid neutralization capacity (ANC) but an
increase of concentrations of NO 3
À , SO 4
2À , and some metal ions (i.e., Al
3+ ). The
pH is an important parameter for indicating degree of acidification and its biological
effects (Matsubara et al. 2009). The ANC of waters is another important parameter,
which was widely used as an indicator for the sensitivity of surface water to
acidification. The ANC was calculated using Formula 8.1, which was based on the
charge balance of major ions (Reuss et al. 1986):
ANC ¼ Ca
2þ
Â
à þ Mg
2þ
Â
à þ K
þ
½ þ Na
þ
½
À SO 4
2À
Â
à À NO 3
À
½
À Cl
À
½
À F
À
½
ð8:1Þ
where the square brackets indicate the ion concentrations in meq L
À1 . A decreasing
trend of pH and ANC of surface water was usually observed during the acidification
periods, particularly in acid-sensitive regions (Henriksen et al. 1992). The water
bodies are considered to be acidified when pH is <6.0 and ANC is 0.2 meq L
À1
(Henriksen et al. 1992).
The surface water acidification occurred at most areas of Europe and North
America since the 1950s, resulting from the elevated acid deposition. It had led to
the decreasing abundance of freshwater biota (Christophersen et al. 1982, Reuss
et al. 1987; Charles and Christie 1991; Likens and Bormann 1995). As a reversible
process, the acidification of surface water was recovered after the reductions of S and
N emission since the 1980s in Europe and North America (Driscoll et al. 2001;
Sutherland et al. 2015). The reversal of freshwaters from acidification has generally
shown the declining trends of SO 4
2À and NO 3
À concentrations and the increase in
pH (Stoddard et al. 1999; Kahl et al. 2004). However, the diminution of base cations,
particularly Ca
2+ and Mg
2+ , could result in the delay or insignificant increase in
ANC (Lawrence et al. 2015; Strock et al. 2014).
China was regarded as a global hotspot of acid deposition since the 1980s (Zhao
and Sun 1986; Galloway et al. 1987, 2008). Some studies have documented the
increase in S/N deposition and subsequent surface water acidification in the past
decades (Chen 2006; Duan et al. 2011; Yu et al. 2017c). For example, during the
1950s–1990s, weak acidification was found in the upstream region of the Yangtze
River (Chen 2006), the river with largest water discharge in China. Monitoring
results showed that increasing S deposition had caused surface water acidification
during the 1990s in large areas in southwestern China with Haplic Luvisol (purplish
soil). The concentration of SO 4
2À in the Yangtze River grew rapidly and, on average,
162
Q. Yu and L. Duan