

(NAQPMS), combined with the cloud-process and aqueous chemistry module from
the Community Multi-scale Air Quality (CMAQ), showed that the deposition of both
S and N had high values with a range of 16–25 kg S ha
À1 year
À1 and 21–32 kg N ha
À1
year
À1
, respectively, in China in 2007 (Ge et al. 2014).
The emission of NO x started to decline after 2012 (Fig. 8.1), attributed to the
pervasive use of selective catalytic reduction (SCR) in coal-fired power plants
(Wang et al. 2014). Meanwhile, NH 3 emissions from China would decrease after
2015 owing to the limited applications of ammonium bicarbonate (Kang et al. 2016).
Monitoring results showed that the NO 3
À concentration in precipitation decreased
significantly from 2011 to 2015, at a rate of 4.7 Æ 5.0 μeq L
À1 year
À1 (avg. 57.3 μeq
L
À1 ; Itahashi et al. 2018). Modelling results also showed that the total N deposition
declined from 2013 to 2015 (Fig. 8.3). However, the total inorganic N deposition in
throughfall has no significantly declining trend in Tieshanping catchment near
Chongqing city (24 kg N ha
À1 year
À1 at 2011 vs. 21 kg N ha
À1 year
À1 at 2016;
Xie et al. 2017).
Although there were limited monitoring of acid deposition in China, the pH of
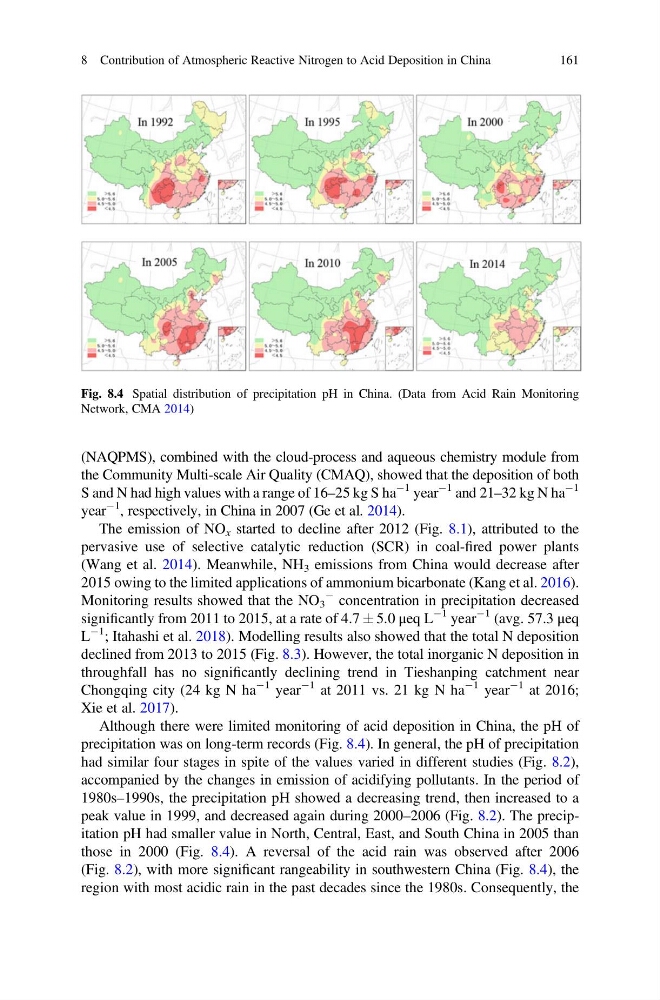
precipitation was on long-term records (Fig. 8.4). In general, the pH of precipitation
had similar four stages in spite of the values varied in different studies (Fig. 8.2),
accompanied by the changes in emission of acidifying pollutants. In the period of
1980s–1990s, the precipitation pH showed a decreasing trend, then increased to a
peak value in 1999, and decreased again during 2000–2006 (Fig. 8.2). The precipitation pH had smaller value in North, Central, East, and South China in 2005 than
those in 2000 (Fig. 8.4). A reversal of the acid rain was observed after 2006
(Fig. 8.2), with more significant rangeability in southwestern China (Fig. 8.4), the
region with most acidic rain in the past decades since the 1980s. Consequently, the
Fig. 8.4 Spatial distribution of precipitation pH in China. (Data from Acid Rain Monitoring
Network, CMA 2014)
8 Contribution of Atmospheric Reactive Nitrogen to Acid Deposition in China
161
the Community Multi-scale Air Quality (CMAQ), showed that the deposition of both
S and N had high values with a range of 16–25 kg S ha
À1 year
À1 and 21–32 kg N ha
À1
year
À1
, respectively, in China in 2007 (Ge et al. 2014).
The emission of NO x started to decline after 2012 (Fig. 8.1), attributed to the
pervasive use of selective catalytic reduction (SCR) in coal-fired power plants
(Wang et al. 2014). Meanwhile, NH 3 emissions from China would decrease after
2015 owing to the limited applications of ammonium bicarbonate (Kang et al. 2016).
Monitoring results showed that the NO 3
À concentration in precipitation decreased
significantly from 2011 to 2015, at a rate of 4.7 Æ 5.0 μeq L
À1 year
À1 (avg. 57.3 μeq
L
À1 ; Itahashi et al. 2018). Modelling results also showed that the total N deposition
declined from 2013 to 2015 (Fig. 8.3). However, the total inorganic N deposition in
throughfall has no significantly declining trend in Tieshanping catchment near
Chongqing city (24 kg N ha
À1 year
À1 at 2011 vs. 21 kg N ha
À1 year
À1 at 2016;
Xie et al. 2017).
Although there were limited monitoring of acid deposition in China, the pH of
precipitation was on long-term records (Fig. 8.4). In general, the pH of precipitation
had similar four stages in spite of the values varied in different studies (Fig. 8.2),
accompanied by the changes in emission of acidifying pollutants. In the period of
1980s–1990s, the precipitation pH showed a decreasing trend, then increased to a
peak value in 1999, and decreased again during 2000–2006 (Fig. 8.2). The precipitation pH had smaller value in North, Central, East, and South China in 2005 than
those in 2000 (Fig. 8.4). A reversal of the acid rain was observed after 2006
(Fig. 8.2), with more significant rangeability in southwestern China (Fig. 8.4), the
region with most acidic rain in the past decades since the 1980s. Consequently, the
Fig. 8.4 Spatial distribution of precipitation pH in China. (Data from Acid Rain Monitoring
Network, CMA 2014)
8 Contribution of Atmospheric Reactive Nitrogen to Acid Deposition in China
161