

5.2.3 Temperature Correction on NH 3 Emission
Compared to the emissions of NO x and N 2 O, the emission of NH 3 is more likely a
physical process, which is strongly related to the meteorological conditions (Sutton
et al. 2013; Warner et al. 2017). We estimate the variation of NH 3 emission due to
climate change based on the climate-dependent paradigm developed by Sutton et al.
(Sutton et al. 2013). The climate-dependent paradigm is generally not region specific
and thus can be applied to China. According to the dissociation thermodynamics and
solubility, NH 3 volatilization almost doubles with an increase of temperature by
5
C, equivalent to a Q 10 (the relative increase over a range of 10
C) of 1–4 (Sutton
et al. 2013). Only agricultural sources of NH 3 emission are considered having the
temperature-dependence effect given few studies quantifying the effect of temperature on nonagricultural sectors (Meng et al. 2017). Based on Sutton et al. (2013), an
average Q 10 of 2 was used for NH 3 emission factors (EFs) from fertilizer application
in this study; an average Q 10 of 1.25 was applied to NH 3 EFs from pigs, sows,
poultry, rabbits, sheep, and goats while an average Q 10 of 2.5 for cattle, horses,
donkeys, and mules. Prior to the calibration of temperature-dependence effects, we
have summarized the average NH 3 EFs using corrected coefficients. Details of the
approach can be found in Zhang et al. (2017).
The annual average temperature for 35 years from 1980 to 2015 was at 9.6
C in
China. We took this temperature as a reference value and warmer or colder annual
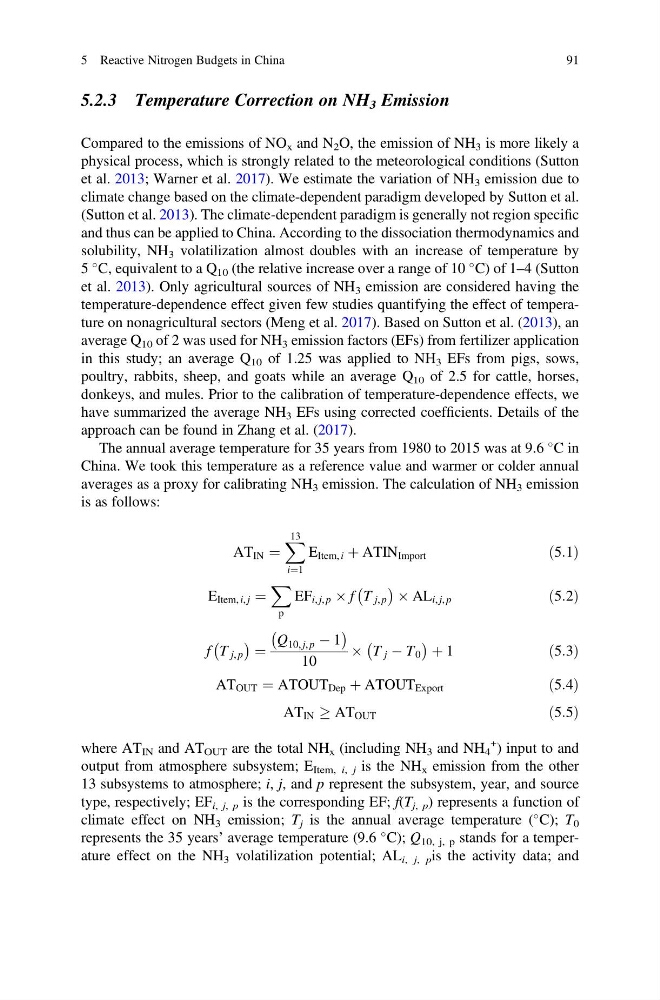
averages as a proxy for calibrating NH 3 emission. The calculation of NH 3 emission
is as follows:
AT IN ¼
X 13
i¼1
E Item, i þ ATIN Import
ð5:1Þ
E Item, i, j ¼
X
p
EF i, j, p  f T j, p
À
Á Â AL i, j, p
ð5:2Þ
f T j, p
À
Á ¼
Q 10, j, p À 1
À
Á
10
 T j À T 0
À
Á þ 1
ð5:3Þ
AT OUT ¼ ATOUT Dep þ ATOUT Export
ð5:4Þ
AT IN ! AT OUT
ð5:5Þ
where AT IN and AT OUT are the total NH x (including NH 3 and NH 4
+
) input to and
output from atmosphere subsystem; E Item, i, j is the NH x emission from the other
13 subsystems to atmosphere; i, j, and p represent the subsystem, year, and source
type, respectively; EF i, j, p is the corresponding EF; f(T j, p ) represents a function of
climate effect on NH 3 emission; T j is the annual average temperature (
C); T 0
represents the 35 years’ average temperature (9.6
C); Q 10, j, p stands for a temperature effect on the NH 3 volatilization potential; AL i, j, p is the activity data; and
5 Reactive Nitrogen Budgets in China
91
Compared to the emissions of NO x and N 2 O, the emission of NH 3 is more likely a
physical process, which is strongly related to the meteorological conditions (Sutton
et al. 2013; Warner et al. 2017). We estimate the variation of NH 3 emission due to
climate change based on the climate-dependent paradigm developed by Sutton et al.
(Sutton et al. 2013). The climate-dependent paradigm is generally not region specific
and thus can be applied to China. According to the dissociation thermodynamics and
solubility, NH 3 volatilization almost doubles with an increase of temperature by
5
C, equivalent to a Q 10 (the relative increase over a range of 10
C) of 1–4 (Sutton
et al. 2013). Only agricultural sources of NH 3 emission are considered having the
temperature-dependence effect given few studies quantifying the effect of temperature on nonagricultural sectors (Meng et al. 2017). Based on Sutton et al. (2013), an
average Q 10 of 2 was used for NH 3 emission factors (EFs) from fertilizer application
in this study; an average Q 10 of 1.25 was applied to NH 3 EFs from pigs, sows,
poultry, rabbits, sheep, and goats while an average Q 10 of 2.5 for cattle, horses,
donkeys, and mules. Prior to the calibration of temperature-dependence effects, we
have summarized the average NH 3 EFs using corrected coefficients. Details of the
approach can be found in Zhang et al. (2017).
The annual average temperature for 35 years from 1980 to 2015 was at 9.6
C in
China. We took this temperature as a reference value and warmer or colder annual
averages as a proxy for calibrating NH 3 emission. The calculation of NH 3 emission
is as follows:
AT IN ¼
X 13
i¼1
E Item, i þ ATIN Import
ð5:1Þ
E Item, i, j ¼
X
p
EF i, j, p  f T j, p
À
Á Â AL i, j, p
ð5:2Þ
f T j, p
À
Á ¼
Q 10, j, p À 1
À
Á
10
 T j À T 0
À
Á þ 1
ð5:3Þ
AT OUT ¼ ATOUT Dep þ ATOUT Export
ð5:4Þ
AT IN ! AT OUT
ð5:5Þ
where AT IN and AT OUT are the total NH x (including NH 3 and NH 4
+
) input to and
output from atmosphere subsystem; E Item, i, j is the NH x emission from the other
13 subsystems to atmosphere; i, j, and p represent the subsystem, year, and source
type, respectively; EF i, j, p is the corresponding EF; f(T j, p ) represents a function of
climate effect on NH 3 emission; T j is the annual average temperature (
C); T 0
represents the 35 years’ average temperature (9.6
C); Q 10, j, p stands for a temperature effect on the NH 3 volatilization potential; AL i, j, p is the activity data; and
5 Reactive Nitrogen Budgets in China
91