

541
pers, watermelon) are sold in Dar es Salaam and other neighbouring towns such as
Morogoro and Dodoma come from Iringa. This is facilitated by the presence of a
good road network from Iringa to other regions where the products are sold.
Irrigation enables farmers to have several crop cycles in a year, since they are confident of the markets all the time. Most of these crops are common for WC1 to WC4.
Crops like maize, especially dry maize, sorghum and cassava, which are common
for WC1, are mostly seasonal. Farmers depend on rainfall and do not invest in water
lifting devices and pumps because of the weather and market uncertainty, unlike
those in the other water control technologies. The farmers in WC3 and WC4 normally have all-round market exposure, compared to those in WC1.
4 Discussion of the Findings
The study has examined the several technologies that farmers use to irrigate their
crops, ranging from simple technologies such as buckets and manual pumps (e.g.
treadle, concrete) to motorized pumps. It has revealed that the disparities in water
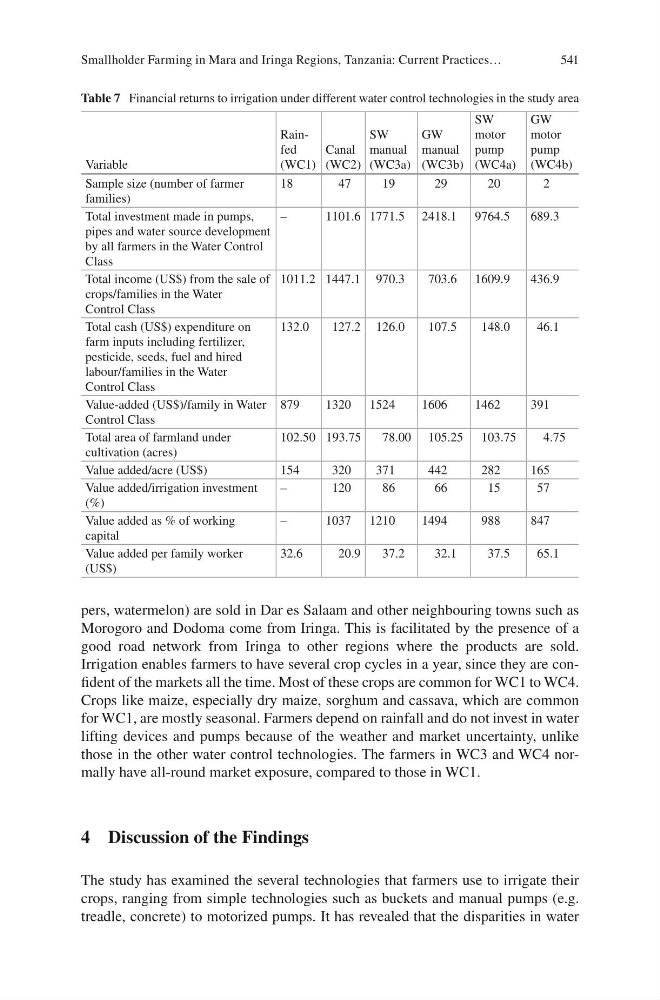
Table 7 Financial returns to irrigation under different water control technologies in the study area
Variable
Rainfed
(WC1)
Canal
(WC2)
SW
manual
(WC3a)
GW
manual
(WC3b)
SW
motor
pump
(WC4a)
GW
motor
pump
(WC4b)
Sample size (number of farmer
families)
18
47
19
29
20
2
Total investment made in pumps,
pipes and water source development
by all farmers in the Water Control
Class
–
1101.6 1771.5 2418.1 9764.5
689.3
Total income (US$) from the sale of
crops/families in the Water
Control Class
1011.2 1447.1 970.3
703.6 1609.9
436.9
Total cash (US$) expenditure on
farm inputs including fertilizer,
pesticide, seeds, fuel and hired
labour/families in the Water
Control Class
132.0
127.2 126.0
107.5
148.0
46.1
Value-added (US$)/family in Water
Control Class
879
1320 1524
1606
1462
391
Total area of farmland under
cultivation (acres)
102.50 193.75
78.00 105.25 103.75
4.75
Value added/acre (US$)
154
320
371
442
282
165
Value added/irrigation investment
(%)
–
120
86
66
15
57
Value added as % of working
capital
–
1037 1210
1494
988
847
Value added per family worker
(US$)
32.6
20.9
37.2
32.1
37.5
65.1
Smallholder Farming in Mara and Iringa Regions, Tanzania: Current Practices…
pers, watermelon) are sold in Dar es Salaam and other neighbouring towns such as
Morogoro and Dodoma come from Iringa. This is facilitated by the presence of a
good road network from Iringa to other regions where the products are sold.
Irrigation enables farmers to have several crop cycles in a year, since they are confident of the markets all the time. Most of these crops are common for WC1 to WC4.
Crops like maize, especially dry maize, sorghum and cassava, which are common
for WC1, are mostly seasonal. Farmers depend on rainfall and do not invest in water
lifting devices and pumps because of the weather and market uncertainty, unlike
those in the other water control technologies. The farmers in WC3 and WC4 normally have all-round market exposure, compared to those in WC1.
4 Discussion of the Findings
The study has examined the several technologies that farmers use to irrigate their
crops, ranging from simple technologies such as buckets and manual pumps (e.g.
treadle, concrete) to motorized pumps. It has revealed that the disparities in water
Table 7 Financial returns to irrigation under different water control technologies in the study area
Variable
Rainfed
(WC1)
Canal
(WC2)
SW
manual
(WC3a)
GW
manual
(WC3b)
SW
motor
pump
(WC4a)
GW
motor
pump
(WC4b)
Sample size (number of farmer
families)
18
47
19
29
20
2
Total investment made in pumps,
pipes and water source development
by all farmers in the Water Control
Class
–
1101.6 1771.5 2418.1 9764.5
689.3
Total income (US$) from the sale of
crops/families in the Water
Control Class
1011.2 1447.1 970.3
703.6 1609.9
436.9
Total cash (US$) expenditure on
farm inputs including fertilizer,
pesticide, seeds, fuel and hired
labour/families in the Water
Control Class
132.0
127.2 126.0
107.5
148.0
46.1
Value-added (US$)/family in Water
Control Class
879
1320 1524
1606
1462
391
Total area of farmland under
cultivation (acres)
102.50 193.75
78.00 105.25 103.75
4.75
Value added/acre (US$)
154
320
371
442
282
165
Value added/irrigation investment
(%)
–
120
86
66
15
57
Value added as % of working
capital
–
1037 1210
1494
988
847
Value added per family worker
(US$)
32.6
20.9
37.2
32.1
37.5
65.1
Smallholder Farming in Mara and Iringa Regions, Tanzania: Current Practices…