

520
60
50
40
30
20
10
0
Female
M ale
Step 1: almost no capacity to adapt to
climate change
Step 2: only little capacity to adapt to
climate change
Step 3: capacity to adapt to some of the
climate change impacts and effects
Step 4: capacity to adapt to many climate
change impacts and effects
Step 5: capacity to adapt to all the climate
change impacts and effects
Sex of respondent
Number of respondents
On which step of the ladder would
you position yourself now (2018)
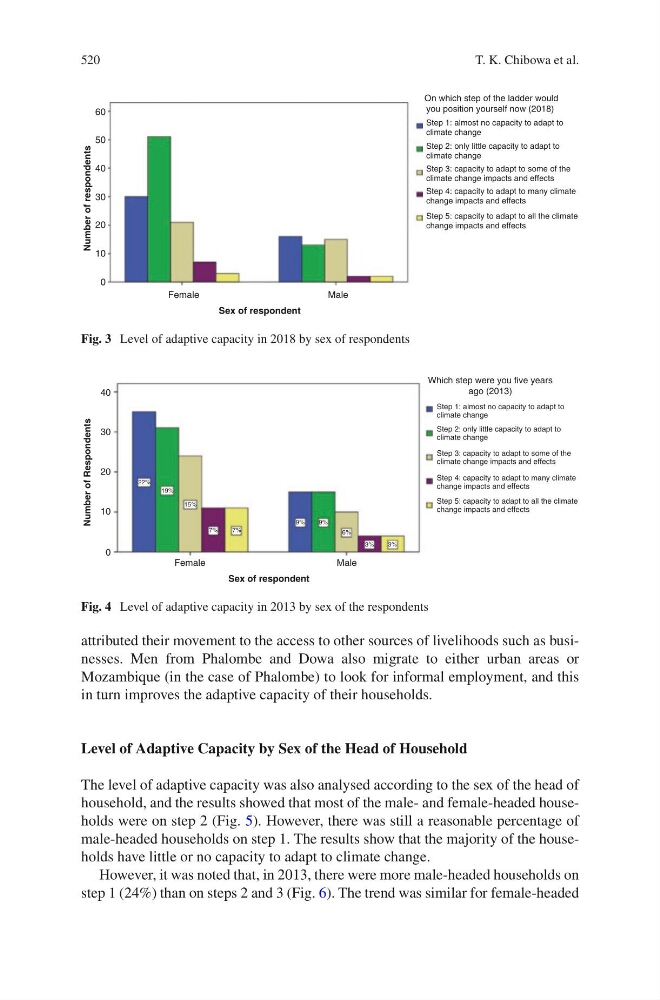
Fig. 3 Level of adaptive capacity in 2018 by sex of respondents
40
30
20
10
0
Female
M ale
Which step were you five years
ago (2013)
Step 1: almost no capacity to adapt to
climate change
Step 2: only little capacity to adapt to
climate change
Step 3: capacity to adapt to some of the
climate change impacts and effects
Step 4: capacity to adapt to many climate
change impacts and effects
Step 5: capacity to adapt to all the climate
change impacts and effects
Sex of respondent
Number of Respondents
22%
19%
15%
7%
7%
9%
9%
6%
3%
3%
Fig. 4 Level of adaptive capacity in 2013 by sex of the respondents
attributed their movement to the access to other sources of livelihoods such as businesses. Men from Phalombe and Dowa also migrate to either urban areas or
Mozambique (in the case of Phalombe) to look for informal employment, and this
in turn improves the adaptive capacity of their households.
Level of Adaptive Capacity by Sex of the Head of Household
The level of adaptive capacity was also analysed according to the sex of the head of
household, and the results showed that most of the male- and female-headed households were on step 2 (Fig. 5). However, there was still a reasonable percentage of
male-headed households on step 1. The results show that the majority of the households have little or no capacity to adapt to climate change.
However, it was noted that, in 2013, there were more male-headed households on
step 1 (24%) than on steps 2 and 3 (Fig. 6). The trend was similar for female-headed
T. K. Chibowa et al.
60
50
40
30
20
10
0
Female
M ale
Step 1: almost no capacity to adapt to
climate change
Step 2: only little capacity to adapt to
climate change
Step 3: capacity to adapt to some of the
climate change impacts and effects
Step 4: capacity to adapt to many climate
change impacts and effects
Step 5: capacity to adapt to all the climate
change impacts and effects
Sex of respondent
Number of respondents
On which step of the ladder would
you position yourself now (2018)
Fig. 3 Level of adaptive capacity in 2018 by sex of respondents
40
30
20
10
0
Female
M ale
Which step were you five years
ago (2013)
Step 1: almost no capacity to adapt to
climate change
Step 2: only little capacity to adapt to
climate change
Step 3: capacity to adapt to some of the
climate change impacts and effects
Step 4: capacity to adapt to many climate
change impacts and effects
Step 5: capacity to adapt to all the climate
change impacts and effects
Sex of respondent
Number of Respondents
22%
19%
15%
7%
7%
9%
9%
6%
3%
3%
Fig. 4 Level of adaptive capacity in 2013 by sex of the respondents
attributed their movement to the access to other sources of livelihoods such as businesses. Men from Phalombe and Dowa also migrate to either urban areas or
Mozambique (in the case of Phalombe) to look for informal employment, and this
in turn improves the adaptive capacity of their households.
Level of Adaptive Capacity by Sex of the Head of Household
The level of adaptive capacity was also analysed according to the sex of the head of
household, and the results showed that most of the male- and female-headed households were on step 2 (Fig. 5). However, there was still a reasonable percentage of
male-headed households on step 1. The results show that the majority of the households have little or no capacity to adapt to climate change.
However, it was noted that, in 2013, there were more male-headed households on
step 1 (24%) than on steps 2 and 3 (Fig. 6). The trend was similar for female-headed
T. K. Chibowa et al.