

483
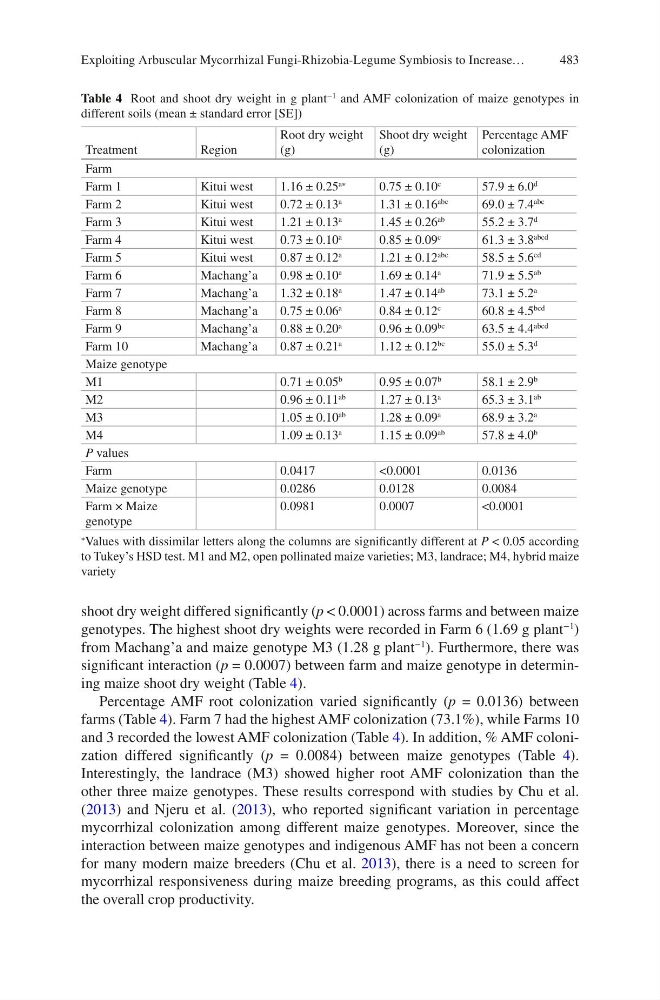
shoot dry weight differed significantly (p < 0.0001) across farms and between maize
genotypes. The highest shoot dry weights were recorded in Farm 6 (1.69 g plant
−1
)
from Machang’a and maize genotype M3 (1.28 g plant
−1
). Furthermore, there was
significant interaction (p = 0.0007) between farm and maize genotype in determining maize shoot dry weight (Table 4).
Percentage AMF root colonization varied significantly (p = 0.0136) between
farms (Table 4). Farm 7 had the highest AMF colonization (73.1%), while Farms 10
and 3 recorded the lowest AMF colonization (Table 4). In addition, % AMF colonization differed significantly (p = 0.0084) between maize genotypes (Table 4).
Interestingly, the landrace (M3) showed higher root AMF colonization than the
other three maize genotypes. These results correspond with studies by Chu et al.
(2013) and Njeru et al. (2013), who reported significant variation in percentage
mycorrhizal colonization among different maize genotypes. Moreover, since the
interaction between maize genotypes and indigenous AMF has not been a concern
for many modern maize breeders (Chu et al. 2013), there is a need to screen for
mycorrhizal responsiveness during maize breeding programs, as this could affect
the overall crop productivity.
Table 4 Root and shoot dry weight in g plant
−1 and AMF colonization of maize genotypes in
different soils (mean ± standard error [SE])
Treatment
Region
Root dry weight
(g)
Shoot dry weight
(g)
Percentage AMF
colonization
Farm
Farm 1
Kitui west
1.16 ± 0.25
a∗
0.75 ± 0.10
c
57.9 ± 6.0
d
Farm 2
Kitui west
0.72 ± 0.13
a
1.31 ± 0.16
abc
69.0 ± 7.4
abc
Farm 3
Kitui west
1.21 ± 0.13
a
1.45 ± 0.26
ab
55.2 ± 3.7
d
Farm 4
Kitui west
0.73 ± 0.10
a
0.85 ± 0.09
c
61.3 ± 3.8
abcd
Farm 5
Kitui west
0.87 ± 0.12
a
1.21 ± 0.12
abc
58.5 ± 5.6
cd
Farm 6
Machang’a
0.98 ± 0.10
a
1.69 ± 0.14
a
71.9 ± 5.5
ab
Farm 7
Machang’a
1.32 ± 0.18
a
1.47 ± 0.14
ab
73.1 ± 5.2
a
Farm 8
Machang’a
0.75 ± 0.06
a
0.84 ± 0.12
c
60.8 ± 4.5
bcd
Farm 9
Machang’a
0.88 ± 0.20
a
0.96 ± 0.09
bc
63.5 ± 4.4
abcd
Farm 10
Machang’a
0.87 ± 0.21
a
1.12 ± 0.12
bc
55.0 ± 5.3
d
Maize genotype
M1
0.71 ± 0.05
b
0.95 ± 0.07
b
58.1 ± 2.9
b
M2
0.96 ± 0.11
ab
1.27 ± 0.13
a
65.3 ± 3.1
ab
M3
1.05 ± 0.10
ab
1.28 ± 0.09
a
68.9 ± 3.2
a
M4
1.09 ± 0.13
a
1.15 ± 0.09
ab
57.8 ± 4.0
b
P values
Farm
0.0417
<0.0001
0.0136
Maize genotype
0.0286
0.0128
0.0084
Farm × Maize
genotype
0.0981
0.0007
<0.0001
∗
Values with dissimilar letters along the columns are significantly different at P < 0.05 according
to Tukey’s HSD test. M1 and M2, open pollinated maize varieties; M3, landrace; M4, hybrid maize
variety
Exploiting Arbuscular Mycorrhizal Fungi-Rhizobia-Legume Symbiosis to Increase…
shoot dry weight differed significantly (p < 0.0001) across farms and between maize
genotypes. The highest shoot dry weights were recorded in Farm 6 (1.69 g plant
−1
)
from Machang’a and maize genotype M3 (1.28 g plant
−1
). Furthermore, there was
significant interaction (p = 0.0007) between farm and maize genotype in determining maize shoot dry weight (Table 4).
Percentage AMF root colonization varied significantly (p = 0.0136) between
farms (Table 4). Farm 7 had the highest AMF colonization (73.1%), while Farms 10
and 3 recorded the lowest AMF colonization (Table 4). In addition, % AMF colonization differed significantly (p = 0.0084) between maize genotypes (Table 4).
Interestingly, the landrace (M3) showed higher root AMF colonization than the
other three maize genotypes. These results correspond with studies by Chu et al.
(2013) and Njeru et al. (2013), who reported significant variation in percentage
mycorrhizal colonization among different maize genotypes. Moreover, since the
interaction between maize genotypes and indigenous AMF has not been a concern
for many modern maize breeders (Chu et al. 2013), there is a need to screen for
mycorrhizal responsiveness during maize breeding programs, as this could affect
the overall crop productivity.
Table 4 Root and shoot dry weight in g plant
−1 and AMF colonization of maize genotypes in
different soils (mean ± standard error [SE])
Treatment
Region
Root dry weight
(g)
Shoot dry weight
(g)
Percentage AMF
colonization
Farm
Farm 1
Kitui west
1.16 ± 0.25
a∗
0.75 ± 0.10
c
57.9 ± 6.0
d
Farm 2
Kitui west
0.72 ± 0.13
a
1.31 ± 0.16
abc
69.0 ± 7.4
abc
Farm 3
Kitui west
1.21 ± 0.13
a
1.45 ± 0.26
ab
55.2 ± 3.7
d
Farm 4
Kitui west
0.73 ± 0.10
a
0.85 ± 0.09
c
61.3 ± 3.8
abcd
Farm 5
Kitui west
0.87 ± 0.12
a
1.21 ± 0.12
abc
58.5 ± 5.6
cd
Farm 6
Machang’a
0.98 ± 0.10
a
1.69 ± 0.14
a
71.9 ± 5.5
ab
Farm 7
Machang’a
1.32 ± 0.18
a
1.47 ± 0.14
ab
73.1 ± 5.2
a
Farm 8
Machang’a
0.75 ± 0.06
a
0.84 ± 0.12
c
60.8 ± 4.5
bcd
Farm 9
Machang’a
0.88 ± 0.20
a
0.96 ± 0.09
bc
63.5 ± 4.4
abcd
Farm 10
Machang’a
0.87 ± 0.21
a
1.12 ± 0.12
bc
55.0 ± 5.3
d
Maize genotype
M1
0.71 ± 0.05
b
0.95 ± 0.07
b
58.1 ± 2.9
b
M2
0.96 ± 0.11
ab
1.27 ± 0.13
a
65.3 ± 3.1
ab
M3
1.05 ± 0.10
ab
1.28 ± 0.09
a
68.9 ± 3.2
a
M4
1.09 ± 0.13
a
1.15 ± 0.09
ab
57.8 ± 4.0
b
P values
Farm
0.0417
<0.0001
0.0136
Maize genotype
0.0286
0.0128
0.0084
Farm × Maize
genotype
0.0981
0.0007
<0.0001
∗
Values with dissimilar letters along the columns are significantly different at P < 0.05 according
to Tukey’s HSD test. M1 and M2, open pollinated maize varieties; M3, landrace; M4, hybrid maize
variety
Exploiting Arbuscular Mycorrhizal Fungi-Rhizobia-Legume Symbiosis to Increase…