

478
cmol.kg
−1
for East African soils as recommended by Okalebo et al. (2002).
Exchangeable calcium ions were above the critical value in all farms except farms
1 and 8 (Table 1).
3.2 Effect of Cowpea Genotypes and Soil Characteristics
on Rhizobia Nodulation
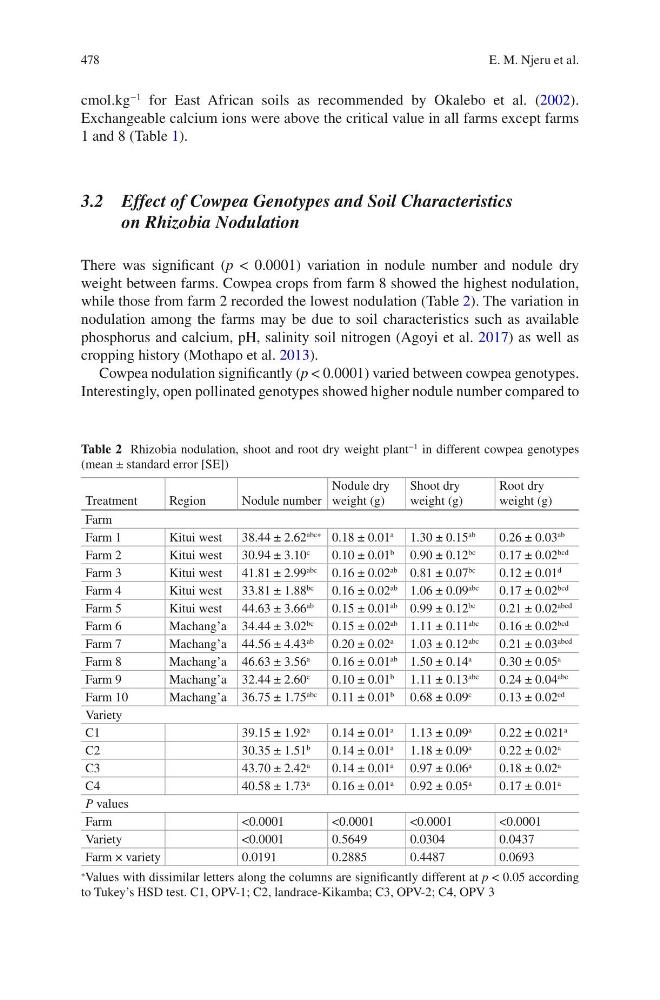
There was significant (p < 0.0001) variation in nodule number and nodule dry
weight between farms. Cowpea crops from farm 8 showed the highest nodulation,
while those from farm 2 recorded the lowest nodulation (Table 2). The variation in
nodulation among the farms may be due to soil characteristics such as available
phosphorus and calcium, pH, salinity soil nitrogen (Agoyi et al. 2017) as well as
cropping history (Mothapo et al. 2013).
Cowpea nodulation significantly (p < 0.0001) varied between cowpea genotypes.
Interestingly, open pollinated genotypes showed higher nodule number compared to
Table 2 Rhizobia nodulation, shoot and root dry weight plant
−1 in different cowpea genotypes
(mean ± standard error [SE])
Treatment
Region
Nodule number
Nodule dry
weight (g)
Shoot dry
weight (g)
Root dry
weight (g)
Farm
Farm 1
Kitui west
38.44 ± 2.62
abc∗ 0.18 ± 0.01
a
1.30 ± 0.15
ab
0.26 ± 0.03
ab
Farm 2
Kitui west
30.94 ± 3.10
c
0.10 ± 0.01
b
0.90 ± 0.12
bc
0.17 ± 0.02
bcd
Farm 3
Kitui west
41.81 ± 2.99
abc
0.16 ± 0.02
ab
0.81 ± 0.07
bc
0.12 ± 0.01
d
Farm 4
Kitui west
33.81 ± 1.88
bc
0.16 ± 0.02
ab
1.06 ± 0.09
abc
0.17 ± 0.02
bcd
Farm 5
Kitui west
44.63 ± 3.66
ab
0.15 ± 0.01
ab
0.99 ± 0.12
bc
0.21 ± 0.02
abcd
Farm 6
Machang’a 34.44 ± 3.02
bc
0.15 ± 0.02
ab
1.11 ± 0.11
abc
0.16 ± 0.02
bcd
Farm 7
Machang’a 44.56 ± 4.43
ab
0.20 ± 0.02
a
1.03 ± 0.12
abc
0.21 ± 0.03
abcd
Farm 8
Machang’a 46.63 ± 3.56
a
0.16 ± 0.01
ab
1.50 ± 0.14
a
0.30 ± 0.05
a
Farm 9
Machang’a 32.44 ± 2.60
c
0.10 ± 0.01
b
1.11 ± 0.13
abc
0.24 ± 0.04
abc
Farm 10
Machang’a 36.75 ± 1.75
abc
0.11 ± 0.01
b
0.68 ± 0.09
c
0.13 ± 0.02
cd
Variety
C1
39.15 ± 1.92
a
0.14 ± 0.01
a
1.13 ± 0.09
a
0.22 ± 0.021
a
C2
30.35 ± 1.51
b
0.14 ± 0.01
a
1.18 ± 0.09
a
0.22 ± 0.02
a
C3
43.70 ± 2.42
a
0.14 ± 0.01
a
0.97 ± 0.06
a
0.18 ± 0.02
a
C4
40.58 ± 1.73
a
0.16 ± 0.01
a
0.92 ± 0.05
a
0.17 ± 0.01
a
P values
Farm
<0.0001
<0.0001
<0.0001
<0.0001
Variety
<0.0001
0.5649
0.0304
0.0437
Farm × variety
0.0191
0.2885
0.4487
0.0693
∗ Values with dissimilar letters along the columns are significantly different at p < 0.05 according
to Tukey’s HSD test. C1, OPV-1; C2, landrace-Kikamba; C3, OPV-2; C4, OPV 3
E. M. Njeru et al.
cmol.kg
−1
for East African soils as recommended by Okalebo et al. (2002).
Exchangeable calcium ions were above the critical value in all farms except farms
1 and 8 (Table 1).
3.2 Effect of Cowpea Genotypes and Soil Characteristics
on Rhizobia Nodulation
There was significant (p < 0.0001) variation in nodule number and nodule dry
weight between farms. Cowpea crops from farm 8 showed the highest nodulation,
while those from farm 2 recorded the lowest nodulation (Table 2). The variation in
nodulation among the farms may be due to soil characteristics such as available
phosphorus and calcium, pH, salinity soil nitrogen (Agoyi et al. 2017) as well as
cropping history (Mothapo et al. 2013).
Cowpea nodulation significantly (p < 0.0001) varied between cowpea genotypes.
Interestingly, open pollinated genotypes showed higher nodule number compared to
Table 2 Rhizobia nodulation, shoot and root dry weight plant
−1 in different cowpea genotypes
(mean ± standard error [SE])
Treatment
Region
Nodule number
Nodule dry
weight (g)
Shoot dry
weight (g)
Root dry
weight (g)
Farm
Farm 1
Kitui west
38.44 ± 2.62
abc∗ 0.18 ± 0.01
a
1.30 ± 0.15
ab
0.26 ± 0.03
ab
Farm 2
Kitui west
30.94 ± 3.10
c
0.10 ± 0.01
b
0.90 ± 0.12
bc
0.17 ± 0.02
bcd
Farm 3
Kitui west
41.81 ± 2.99
abc
0.16 ± 0.02
ab
0.81 ± 0.07
bc
0.12 ± 0.01
d
Farm 4
Kitui west
33.81 ± 1.88
bc
0.16 ± 0.02
ab
1.06 ± 0.09
abc
0.17 ± 0.02
bcd
Farm 5
Kitui west
44.63 ± 3.66
ab
0.15 ± 0.01
ab
0.99 ± 0.12
bc
0.21 ± 0.02
abcd
Farm 6
Machang’a 34.44 ± 3.02
bc
0.15 ± 0.02
ab
1.11 ± 0.11
abc
0.16 ± 0.02
bcd
Farm 7
Machang’a 44.56 ± 4.43
ab
0.20 ± 0.02
a
1.03 ± 0.12
abc
0.21 ± 0.03
abcd
Farm 8
Machang’a 46.63 ± 3.56
a
0.16 ± 0.01
ab
1.50 ± 0.14
a
0.30 ± 0.05
a
Farm 9
Machang’a 32.44 ± 2.60
c
0.10 ± 0.01
b
1.11 ± 0.13
abc
0.24 ± 0.04
abc
Farm 10
Machang’a 36.75 ± 1.75
abc
0.11 ± 0.01
b
0.68 ± 0.09
c
0.13 ± 0.02
cd
Variety
C1
39.15 ± 1.92
a
0.14 ± 0.01
a
1.13 ± 0.09
a
0.22 ± 0.021
a
C2
30.35 ± 1.51
b
0.14 ± 0.01
a
1.18 ± 0.09
a
0.22 ± 0.02
a
C3
43.70 ± 2.42
a
0.14 ± 0.01
a
0.97 ± 0.06
a
0.18 ± 0.02
a
C4
40.58 ± 1.73
a
0.16 ± 0.01
a
0.92 ± 0.05
a
0.17 ± 0.01
a
P values
Farm
<0.0001
<0.0001
<0.0001
<0.0001
Variety
<0.0001
0.5649
0.0304
0.0437
Farm × variety
0.0191
0.2885
0.4487
0.0693
∗ Values with dissimilar letters along the columns are significantly different at p < 0.05 according
to Tukey’s HSD test. C1, OPV-1; C2, landrace-Kikamba; C3, OPV-2; C4, OPV 3
E. M. Njeru et al.