

477
3 Results and Discussion
3.1 Soil Characteristics
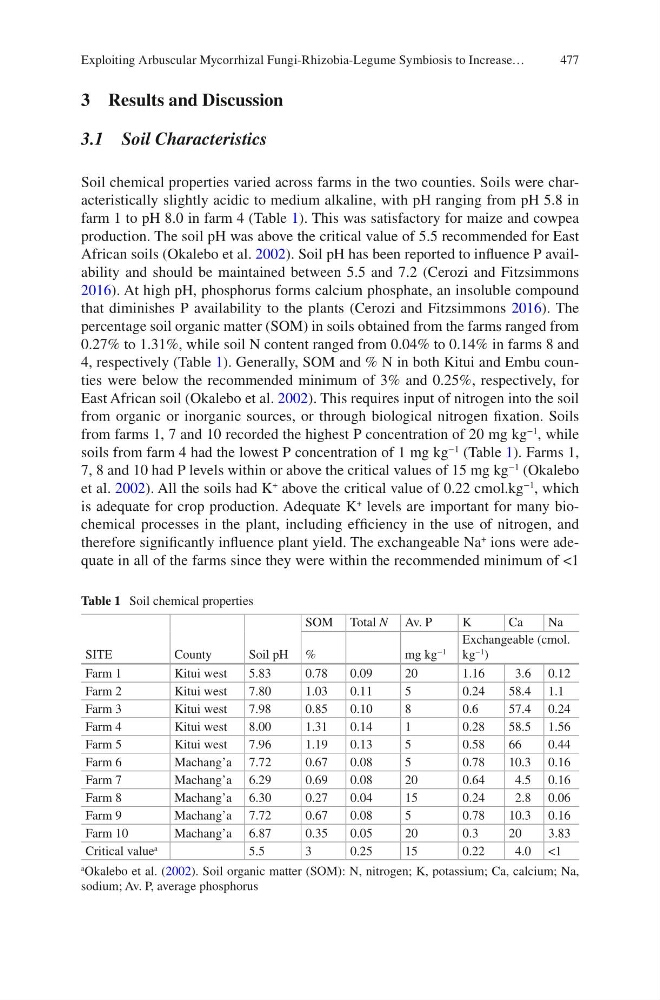
Soil chemical properties varied across farms in the two counties. Soils were characteristically slightly acidic to medium alkaline, with pH ranging from pH 5.8 in
farm 1 to pH 8.0 in farm 4 (Table 1). This was satisfactory for maize and cowpea
production. The soil pH was above the critical value of 5.5 recommended for East
African soils (Okalebo et al. 2002). Soil pH has been reported to influence P availability and should be maintained between 5.5 and 7.2 (Cerozi and Fitzsimmons
2016). At high pH, phosphorus forms calcium phosphate, an insoluble compound
that diminishes P availability to the plants (Cerozi and Fitzsimmons 2016). The
percentage soil organic matter (SOM) in soils obtained from the farms ranged from
0.27% to 1.31%, while soil N content ranged from 0.04% to 0.14% in farms 8 and
4, respectively (Table 1). Generally, SOM and % N in both Kitui and Embu counties were below the recommended minimum of 3% and 0.25%, respectively, for
East African soil (Okalebo et al. 2002). This requires input of nitrogen into the soil
from organic or inorganic sources, or through biological nitrogen fixation. Soils
from farms 1, 7 and 10 recorded the highest P concentration of 20 mg kg
−1
, while
soils from farm 4 had the lowest P concentration of 1 mg kg
−1
(Table 1). Farms 1,
7, 8 and 10 had P levels within or above the critical values of 15 mg kg
−1
(Okalebo
et al. 2002). All the soils had K
+
above the critical value of 0.22 cmol.kg
−1
, which
is adequate for crop production. Adequate K
+
levels are important for many biochemical processes in the plant, including efficiency in the use of nitrogen, and
therefore significantly influence plant yield. The exchangeable Na
+
ions were adequate in all of the farms since they were within the recommended minimum of <1
Table 1 Soil chemical properties
SITE
County
Soil pH
SOM Total N Av. P
K
Ca
Na
%
mg kg
−1
Exchangeable (cmol.
kg
−1 )
Farm 1
Kitui west
5.83
0.78
0.09
20
1.16
3.6 0.12
Farm 2
Kitui west
7.80
1.03
0.11
5
0.24
58.4 1.1
Farm 3
Kitui west
7.98
0.85
0.10
8
0.6
57.4 0.24
Farm 4
Kitui west
8.00
1.31
0.14
1
0.28
58.5 1.56
Farm 5
Kitui west
7.96
1.19
0.13
5
0.58
66
0.44
Farm 6
Machang’a 7.72
0.67
0.08
5
0.78
10.3 0.16
Farm 7
Machang’a 6.29
0.69
0.08
20
0.64
4.5 0.16
Farm 8
Machang’a 6.30
0.27
0.04
15
0.24
2.8 0.06
Farm 9
Machang’a 7.72
0.67
0.08
5
0.78
10.3 0.16
Farm 10
Machang’a 6.87
0.35
0.05
20
0.3
20
3.83
Critical value
a
5.5
3
0.25
15
0.22
4.0 <1
a Okalebo et al. (2002). Soil organic matter (SOM): N, nitrogen; K, potassium; Ca, calcium; Na,
sodium; Av. P, average phosphorus
Exploiting Arbuscular Mycorrhizal Fungi-Rhizobia-Legume Symbiosis to Increase…
3 Results and Discussion
3.1 Soil Characteristics
Soil chemical properties varied across farms in the two counties. Soils were characteristically slightly acidic to medium alkaline, with pH ranging from pH 5.8 in
farm 1 to pH 8.0 in farm 4 (Table 1). This was satisfactory for maize and cowpea
production. The soil pH was above the critical value of 5.5 recommended for East
African soils (Okalebo et al. 2002). Soil pH has been reported to influence P availability and should be maintained between 5.5 and 7.2 (Cerozi and Fitzsimmons
2016). At high pH, phosphorus forms calcium phosphate, an insoluble compound
that diminishes P availability to the plants (Cerozi and Fitzsimmons 2016). The
percentage soil organic matter (SOM) in soils obtained from the farms ranged from
0.27% to 1.31%, while soil N content ranged from 0.04% to 0.14% in farms 8 and
4, respectively (Table 1). Generally, SOM and % N in both Kitui and Embu counties were below the recommended minimum of 3% and 0.25%, respectively, for
East African soil (Okalebo et al. 2002). This requires input of nitrogen into the soil
from organic or inorganic sources, or through biological nitrogen fixation. Soils
from farms 1, 7 and 10 recorded the highest P concentration of 20 mg kg
−1
, while
soils from farm 4 had the lowest P concentration of 1 mg kg
−1
(Table 1). Farms 1,
7, 8 and 10 had P levels within or above the critical values of 15 mg kg
−1
(Okalebo
et al. 2002). All the soils had K
+
above the critical value of 0.22 cmol.kg
−1
, which
is adequate for crop production. Adequate K
+
levels are important for many biochemical processes in the plant, including efficiency in the use of nitrogen, and
therefore significantly influence plant yield. The exchangeable Na
+
ions were adequate in all of the farms since they were within the recommended minimum of <1
Table 1 Soil chemical properties
SITE
County
Soil pH
SOM Total N Av. P
K
Ca
Na
%
mg kg
−1
Exchangeable (cmol.
kg
−1 )
Farm 1
Kitui west
5.83
0.78
0.09
20
1.16
3.6 0.12
Farm 2
Kitui west
7.80
1.03
0.11
5
0.24
58.4 1.1
Farm 3
Kitui west
7.98
0.85
0.10
8
0.6
57.4 0.24
Farm 4
Kitui west
8.00
1.31
0.14
1
0.28
58.5 1.56
Farm 5
Kitui west
7.96
1.19
0.13
5
0.58
66
0.44
Farm 6
Machang’a 7.72
0.67
0.08
5
0.78
10.3 0.16
Farm 7
Machang’a 6.29
0.69
0.08
20
0.64
4.5 0.16
Farm 8
Machang’a 6.30
0.27
0.04
15
0.24
2.8 0.06
Farm 9
Machang’a 7.72
0.67
0.08
5
0.78
10.3 0.16
Farm 10
Machang’a 6.87
0.35
0.05
20
0.3
20
3.83
Critical value
a
5.5
3
0.25
15
0.22
4.0 <1
a Okalebo et al. (2002). Soil organic matter (SOM): N, nitrogen; K, potassium; Ca, calcium; Na,
sodium; Av. P, average phosphorus
Exploiting Arbuscular Mycorrhizal Fungi-Rhizobia-Legume Symbiosis to Increase…