

456
error terms in equation (4) jointly follow a multivariate normal (MVN) distribution,
having zero conditional mean and unity-normalized variance where μ hpj ~MVN (0, ∑)
and covariance matrix given by:
∑ =
1
1
1
1
1
12 13
1
12
23
2
13
23
3
1
2
3
ρ ρ
ρ
ρ
ρ
ρ
ρ ρ
ρ
ρ ρ ρ
m
m
m
m
m
m
(6)
The off-diagonal element in the matrix represents the unobserved correlation
between the j
th
and m
th
ISFM practice. It thus follows that equation (5) specifies a
MVP model that jointly represents decisions to adopt a particular ISFM practice
while allowing for correlation across the error terms of the unobserved equations.
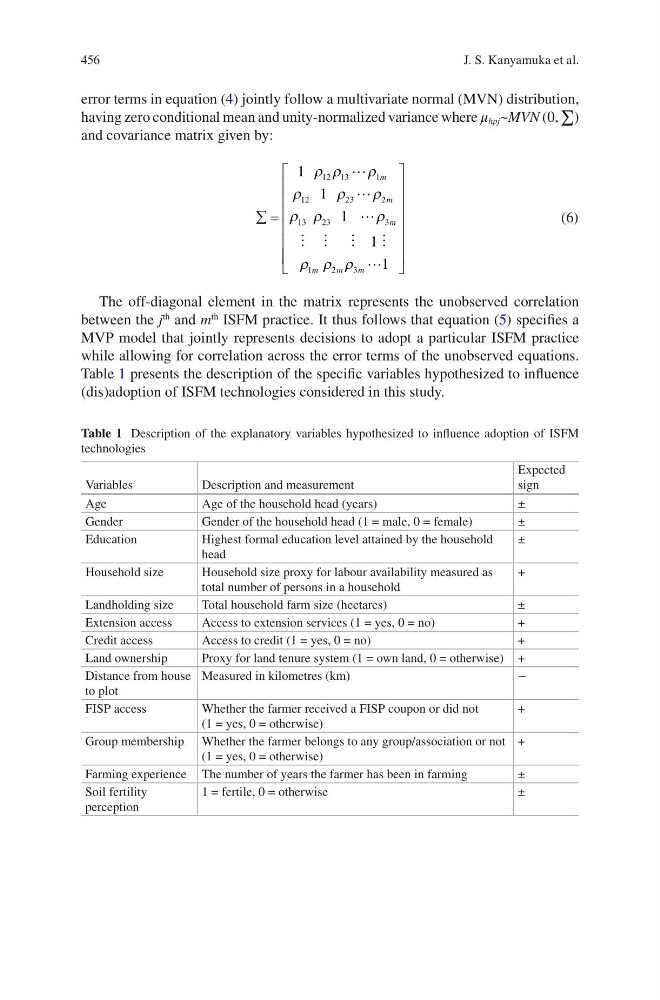
Table 1 presents the description of the specific variables hypothesized to influence
(dis)adoption of ISFM technologies considered in this study.
Table 1 Description of the explanatory variables hypothesized to influence adoption of ISFM
technologies
Variables
Description and measurement
Expected
sign
Age
Age of the household head (years)
±
Gender
Gender of the household head (1 = male, 0 = female)
±
Education
Highest formal education level attained by the household
head
±
Household size
Household size proxy for labour availability measured as
total number of persons in a household
+
Landholding size
Total household farm size (hectares)
±
Extension access
Access to extension services (1 = yes, 0 = no)
+
Credit access
Access to credit (1 = yes, 0 = no)
+
Land ownership
Proxy for land tenure system (1 = own land, 0 = otherwise) +
Distance from house
to plot
Measured in kilometres (km)
−
FISP access
Whether the farmer received a FISP coupon or did not
(1 = yes, 0 = otherwise)
+
Group membership Whether the farmer belongs to any group/association or not
(1 = yes, 0 = otherwise)
+
Farming experience The number of years the farmer has been in farming
±
Soil fertility
perception
1 = fertile, 0 = otherwise
±
J. S. Kanyamuka et al.
error terms in equation (4) jointly follow a multivariate normal (MVN) distribution,
having zero conditional mean and unity-normalized variance where μ hpj ~MVN (0, ∑)
and covariance matrix given by:
∑ =
1
1
1
1
1
12 13
1
12
23
2
13
23
3
1
2
3
ρ ρ
ρ
ρ
ρ
ρ
ρ ρ
ρ
ρ ρ ρ
m
m
m
m
m
m
(6)
The off-diagonal element in the matrix represents the unobserved correlation
between the j
th
and m
th
ISFM practice. It thus follows that equation (5) specifies a
MVP model that jointly represents decisions to adopt a particular ISFM practice
while allowing for correlation across the error terms of the unobserved equations.
Table 1 presents the description of the specific variables hypothesized to influence
(dis)adoption of ISFM technologies considered in this study.
Table 1 Description of the explanatory variables hypothesized to influence adoption of ISFM
technologies
Variables
Description and measurement
Expected
sign
Age
Age of the household head (years)
±
Gender
Gender of the household head (1 = male, 0 = female)
±
Education
Highest formal education level attained by the household
head
±
Household size
Household size proxy for labour availability measured as
total number of persons in a household
+
Landholding size
Total household farm size (hectares)
±
Extension access
Access to extension services (1 = yes, 0 = no)
+
Credit access
Access to credit (1 = yes, 0 = no)
+
Land ownership
Proxy for land tenure system (1 = own land, 0 = otherwise) +
Distance from house
to plot
Measured in kilometres (km)
−
FISP access
Whether the farmer received a FISP coupon or did not
(1 = yes, 0 = otherwise)
+
Group membership Whether the farmer belongs to any group/association or not
(1 = yes, 0 = otherwise)
+
Farming experience The number of years the farmer has been in farming
±
Soil fertility
perception
1 = fertile, 0 = otherwise
±
J. S. Kanyamuka et al.