

389
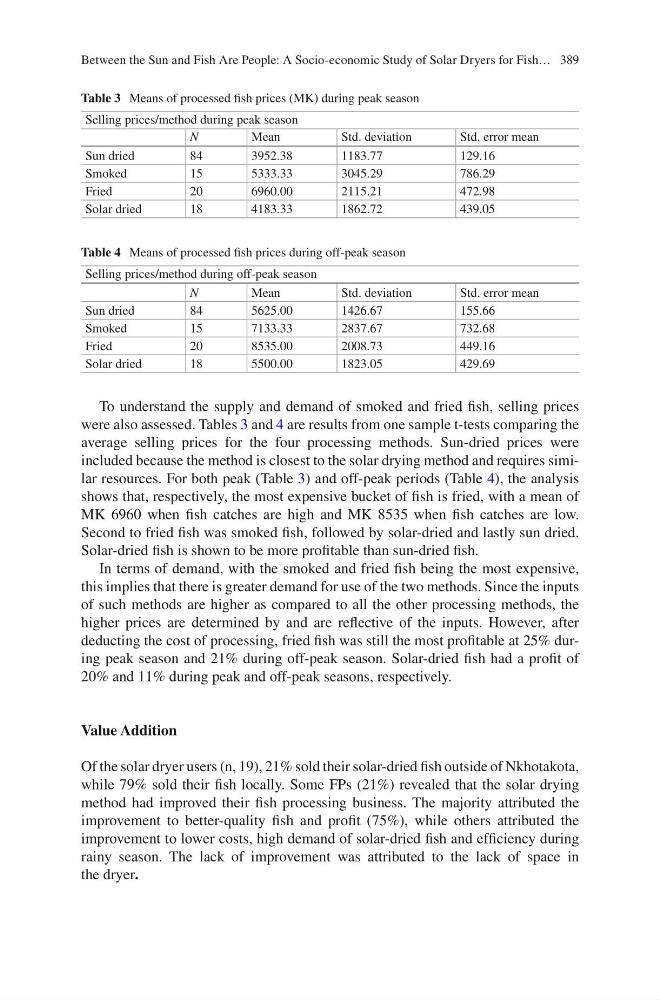
To understand the supply and demand of smoked and fried fish, selling prices
were also assessed. Tables 3 and 4 are results from one sample t-tests comparing the
average selling prices for the four processing methods. Sun-dried prices were
included because the method is closest to the solar drying method and requires similar resources. For both peak (Table 3) and off-peak periods (Table 4), the analysis
shows that, respectively, the most expensive bucket of fish is fried, with a mean of
MK 6960 when fish catches are high and MK 8535 when fish catches are low.
Second to fried fish was smoked fish, followed by solar-dried and lastly sun dried.
Solar-dried fish is shown to be more profitable than sun-dried fish.
In terms of demand, with the smoked and fried fish being the most expensive,
this implies that there is greater demand for use of the two methods. Since the inputs
of such methods are higher as compared to all the other processing methods, the
higher prices are determined by and are reflective of the inputs. However, after
deducting the cost of processing, fried fish was still the most profitable at 25% during peak season and 21% during off-peak season. Solar-dried fish had a profit of
20% and 11% during peak and off-peak seasons, respectively.
Value Addition
Of the solar dryer users (n, 19), 21% sold their solar-dried fish outside of Nkhotakota,
while 79% sold their fish locally. Some FPs (21%) revealed that the solar drying
method had improved their fish processing business. The majority attributed the
improvement to better-quality fish and profit (75%), while others attributed the
improvement to lower costs, high demand of solar-dried fish and efficiency during
rainy season. The lack of improvement was attributed to the lack of space in
the dryer.
Table 3 Means of processed fish prices (MK) during peak season
Selling prices/method during peak season
N
Mean
Std. deviation
Std. error mean
Sun dried
84
3952.38
1183.77
129.16
Smoked
15
5333.33
3045.29
786.29
Fried
20
6960.00
2115.21
472.98
Solar dried
18
4183.33
1862.72
439.05
Table 4 Means of processed fish prices during off-peak season
Selling prices/method during off-peak season
N
Mean
Std. deviation
Std. error mean
Sun dried
84
5625.00
1426.67
155.66
Smoked
15
7133.33
2837.67
732.68
Fried
20
8535.00
2008.73
449.16
Solar dried
18
5500.00
1823.05
429.69
Between the Sun and Fish Are People: A Socio-economic Study of Solar Dryers for Fish…
To understand the supply and demand of smoked and fried fish, selling prices
were also assessed. Tables 3 and 4 are results from one sample t-tests comparing the
average selling prices for the four processing methods. Sun-dried prices were
included because the method is closest to the solar drying method and requires similar resources. For both peak (Table 3) and off-peak periods (Table 4), the analysis
shows that, respectively, the most expensive bucket of fish is fried, with a mean of
MK 6960 when fish catches are high and MK 8535 when fish catches are low.
Second to fried fish was smoked fish, followed by solar-dried and lastly sun dried.
Solar-dried fish is shown to be more profitable than sun-dried fish.
In terms of demand, with the smoked and fried fish being the most expensive,
this implies that there is greater demand for use of the two methods. Since the inputs
of such methods are higher as compared to all the other processing methods, the
higher prices are determined by and are reflective of the inputs. However, after
deducting the cost of processing, fried fish was still the most profitable at 25% during peak season and 21% during off-peak season. Solar-dried fish had a profit of
20% and 11% during peak and off-peak seasons, respectively.
Value Addition
Of the solar dryer users (n, 19), 21% sold their solar-dried fish outside of Nkhotakota,
while 79% sold their fish locally. Some FPs (21%) revealed that the solar drying
method had improved their fish processing business. The majority attributed the
improvement to better-quality fish and profit (75%), while others attributed the
improvement to lower costs, high demand of solar-dried fish and efficiency during
rainy season. The lack of improvement was attributed to the lack of space in
the dryer.
Table 3 Means of processed fish prices (MK) during peak season
Selling prices/method during peak season
N
Mean
Std. deviation
Std. error mean
Sun dried
84
3952.38
1183.77
129.16
Smoked
15
5333.33
3045.29
786.29
Fried
20
6960.00
2115.21
472.98
Solar dried
18
4183.33
1862.72
439.05
Table 4 Means of processed fish prices during off-peak season
Selling prices/method during off-peak season
N
Mean
Std. deviation
Std. error mean
Sun dried
84
5625.00
1426.67
155.66
Smoked
15
7133.33
2837.67
732.68
Fried
20
8535.00
2008.73
449.16
Solar dried
18
5500.00
1823.05
429.69
Between the Sun and Fish Are People: A Socio-economic Study of Solar Dryers for Fish…