

192
4 Discussion
4.1 Yield and Economic Performance
Current Practices
The similarity of cotton yields between current organic and conventional practices can
be linked to the fact that the current input levels in organic and conventional cotton
farming are rather similar. For instance, the N input in the currently practised conventional fertilisation treatment (30 kg N ha
−1
) is similar to the N input from 3 Mg ha
−1
FYM in the currently practised organic fertilisation treatment (30.9 kg N ha
−1
, given
an N content of 1.03% in the applied FYM). This result aligns with Cavigelli et al.
a
ab
c
c
b
ab
ab
0.0
0.5
1.0
1.5
2.0
XF−0 & XP−0
CF−30 & CP−3
CF−60 & CP−6
CF−30+M & CP−3−N+CU
OF−3 & OP−P
OF−5 & OP−P
OF−3+L & OP−N+CU
Combinations of treatments, season 1
Seed cotton yield (Mg/ha)
a
a
a
a
a
a
a
a
0.0
0.5
1.0
1.5
2.0
CF−0 & CP−0
CF−30 & CP−3
CF−60 & CP−6
CF−30+M & CP−3−N+CU
OF−0 & OP−0
OF−3 & OP−P
OF−5 & OP−P
OF−3+L & OP−N+CU
Combinations of treatments, season 2
Seed cotton yield (Mg/ha)
abc
a
a
ab
abc
bc
abc
c
−300
0
300
600
CF−0 & CP−0
CF−30 & CP−3
CF−60 & CP−6
CF−30+M & CP−3−N+CU
OF−0 & OP−0
OF−3 & OP−P
OF−5 & OP−P
OF−3+L & OP−N+CU
Combinations of treatments, season 2
Land rent (US$/ha)
ab
a
abc
bc
cd
cd
d
−300
0
300
600
XF−0 & XP−0
CF−30 & CP−3
CF−60 & CP−6
CF−30+M & CP−3−N+CU
OF−3 & OP−P
OF−5 & OP−P
OF−3+L & OP−N+CU
Combinations of treatments, season 1
Land rent (US$/ha)
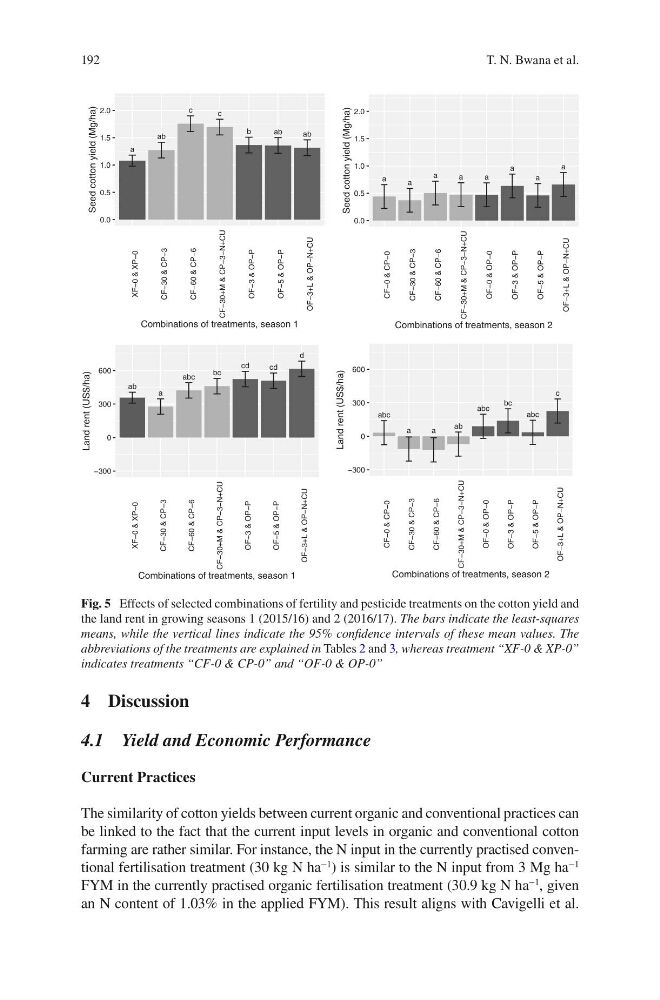
Fig. 5 Effects of selected combinations of fertility and pesticide treatments on the cotton yield and
the land rent in growing seasons 1 (2015/16) and 2 (2016/17). The bars indicate the least-squares
means, while the vertical lines indicate the 95% confidence intervals of these mean values. The
abbreviations of the treatments are explained in Tables 2 and 3, whereas treatment “XF-0 & XP-0”
indicates treatments “CF-0 & CP-0” and “OF-0 & OP-0”
T. N. Bwana et al.
4 Discussion
4.1 Yield and Economic Performance
Current Practices
The similarity of cotton yields between current organic and conventional practices can
be linked to the fact that the current input levels in organic and conventional cotton
farming are rather similar. For instance, the N input in the currently practised conventional fertilisation treatment (30 kg N ha
−1
) is similar to the N input from 3 Mg ha
−1
FYM in the currently practised organic fertilisation treatment (30.9 kg N ha
−1
, given
an N content of 1.03% in the applied FYM). This result aligns with Cavigelli et al.
a
ab
c
c
b
ab
ab
0.0
0.5
1.0
1.5
2.0
XF−0 & XP−0
CF−30 & CP−3
CF−60 & CP−6
CF−30+M & CP−3−N+CU
OF−3 & OP−P
OF−5 & OP−P
OF−3+L & OP−N+CU
Combinations of treatments, season 1
Seed cotton yield (Mg/ha)
a
a
a
a
a
a
a
a
0.0
0.5
1.0
1.5
2.0
CF−0 & CP−0
CF−30 & CP−3
CF−60 & CP−6
CF−30+M & CP−3−N+CU
OF−0 & OP−0
OF−3 & OP−P
OF−5 & OP−P
OF−3+L & OP−N+CU
Combinations of treatments, season 2
Seed cotton yield (Mg/ha)
abc
a
a
ab
abc
bc
abc
c
−300
0
300
600
CF−0 & CP−0
CF−30 & CP−3
CF−60 & CP−6
CF−30+M & CP−3−N+CU
OF−0 & OP−0
OF−3 & OP−P
OF−5 & OP−P
OF−3+L & OP−N+CU
Combinations of treatments, season 2
Land rent (US$/ha)
ab
a
abc
bc
cd
cd
d
−300
0
300
600
XF−0 & XP−0
CF−30 & CP−3
CF−60 & CP−6
CF−30+M & CP−3−N+CU
OF−3 & OP−P
OF−5 & OP−P
OF−3+L & OP−N+CU
Combinations of treatments, season 1
Land rent (US$/ha)
Fig. 5 Effects of selected combinations of fertility and pesticide treatments on the cotton yield and
the land rent in growing seasons 1 (2015/16) and 2 (2016/17). The bars indicate the least-squares
means, while the vertical lines indicate the 95% confidence intervals of these mean values. The
abbreviations of the treatments are explained in Tables 2 and 3, whereas treatment “XF-0 & XP-0”
indicates treatments “CF-0 & CP-0” and “OF-0 & OP-0”
T. N. Bwana et al.