

190
3.3 Yield Compared to Potential Yield
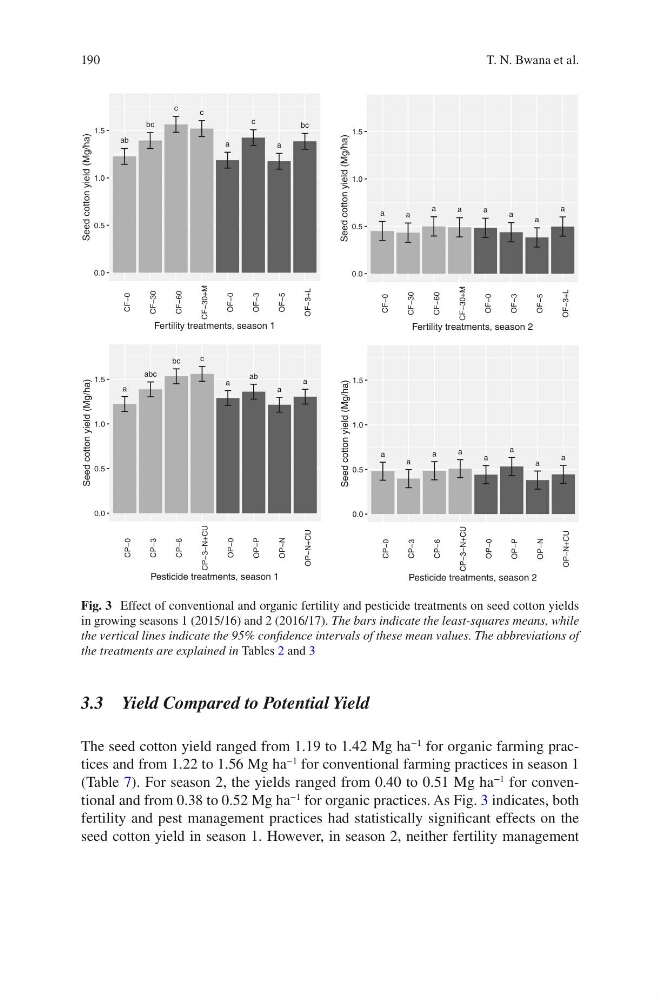
The seed cotton yield ranged from 1.19 to 1.42 Mg ha
−1
for organic farming practices and from 1.22 to 1.56 Mg ha
−1
for conventional farming practices in season 1
(Table 7). For season 2, the yields ranged from 0.40 to 0.51 Mg ha
−1
for conventional and from 0.38 to 0.52 Mg ha
−1
for organic practices. As Fig. 3 indicates, both
fertility and pest management practices had statistically significant effects on the
seed cotton yield in season 1. However, in season 2, neither fertility management
ab
bc
c
c
a
c
a
bc
0.0
0.5
1.0
1.5
CF−0
CF−30
CF−60
CF−30+M
OF−0
OF−3
OF−5
OF−3+L
Fertility treatments, season 1
Seed cotton yield (Mg/ha)
a
abc
bc
c
a
ab
a
a
0.0
0.5
1.0
1.5
CP−0
CP−3
CP−6
CP−3−N+CU
OP−0
OP−P
OP−N
OP−N+CU
Pesticide treatments, season 1
Seed cotton yield (Mg/ha)
a
a
a
a
a
a
a
a
0.0
0.5
1.0
1.5
CF−0
CF−30
CF−60
CF−30+M
OF−0
OF−3
OF−5
OF−3+L
Fertility treatments, season 2
Seed cotton yield (Mg/ha)
a
a
a
a
a
a
a
a
0.0
0.5
1.0
1.5
CP−0
CP−3
CP−6
CP−3−N+CU
OP−0
OP−P
OP−N
OP−N+CU
Pesticide treatments, season 2
Seed cotton yield (Mg/ha)
Fig. 3 Effect of conventional and organic fertility and pesticide treatments on seed cotton yields
in growing seasons 1 (2015/16) and 2 (2016/17). The bars indicate the least-squares means, while
the vertical lines indicate the 95% confidence intervals of these mean values. The abbreviations of
the treatments are explained in Tables 2 and 3
T. N. Bwana et al.
3.3 Yield Compared to Potential Yield
The seed cotton yield ranged from 1.19 to 1.42 Mg ha
−1
for organic farming practices and from 1.22 to 1.56 Mg ha
−1
for conventional farming practices in season 1
(Table 7). For season 2, the yields ranged from 0.40 to 0.51 Mg ha
−1
for conventional and from 0.38 to 0.52 Mg ha
−1
for organic practices. As Fig. 3 indicates, both
fertility and pest management practices had statistically significant effects on the
seed cotton yield in season 1. However, in season 2, neither fertility management
ab
bc
c
c
a
c
a
bc
0.0
0.5
1.0
1.5
CF−0
CF−30
CF−60
CF−30+M
OF−0
OF−3
OF−5
OF−3+L
Fertility treatments, season 1
Seed cotton yield (Mg/ha)
a
abc
bc
c
a
ab
a
a
0.0
0.5
1.0
1.5
CP−0
CP−3
CP−6
CP−3−N+CU
OP−0
OP−P
OP−N
OP−N+CU
Pesticide treatments, season 1
Seed cotton yield (Mg/ha)
a
a
a
a
a
a
a
a
0.0
0.5
1.0
1.5
CF−0
CF−30
CF−60
CF−30+M
OF−0
OF−3
OF−5
OF−3+L
Fertility treatments, season 2
Seed cotton yield (Mg/ha)
a
a
a
a
a
a
a
a
0.0
0.5
1.0
1.5
CP−0
CP−3
CP−6
CP−3−N+CU
OP−0
OP−P
OP−N
OP−N+CU
Pesticide treatments, season 2
Seed cotton yield (Mg/ha)
Fig. 3 Effect of conventional and organic fertility and pesticide treatments on seed cotton yields
in growing seasons 1 (2015/16) and 2 (2016/17). The bars indicate the least-squares means, while
the vertical lines indicate the 95% confidence intervals of these mean values. The abbreviations of
the treatments are explained in Tables 2 and 3
T. N. Bwana et al.