

186
3 Results
3.1 Weather Conditions in the Growing Seasons
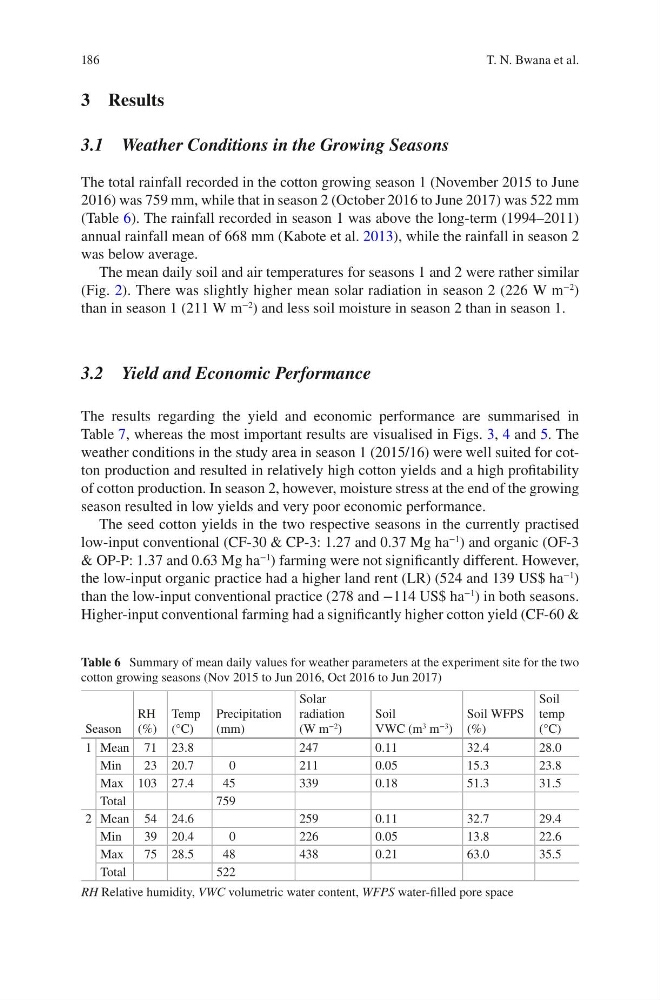
The total rainfall recorded in the cotton growing season 1 (November 2015 to June
2016) was 759 mm, while that in season 2 (October 2016 to June 2017) was 522 mm
(Table 6). The rainfall recorded in season 1 was above the long-term (1994–2011)
annual rainfall mean of 668 mm (Kabote et al. 2013), while the rainfall in season 2
was below average.
The mean daily soil and air temperatures for seasons 1 and 2 were rather similar
(Fig. 2). There was slightly higher mean solar radiation in season 2 (226 W m
−2
)
than in season 1 (211 W m
−2
) and less soil moisture in season 2 than in season 1.
3.2 Yield and Economic Performance
The results regarding the yield and economic performance are summarised in
Table 7, whereas the most important results are visualised in Figs. 3, 4 and 5. The
weather conditions in the study area in season 1 (2015/16) were well suited for cotton production and resulted in relatively high cotton yields and a high profitability
of cotton production. In season 2, however, moisture stress at the end of the growing
season resulted in low yields and very poor economic performance.
The seed cotton yields in the two respective seasons in the currently practised
low-input conventional (CF-30 & CP-3: 1.27 and 0.37 Mg ha
−1
) and organic (OF-3
& OP-P: 1.37 and 0.63 Mg ha
−1
) farming were not significantly different. However,
the low-input organic practice had a higher land rent (LR) (524 and 139 US$ ha
−1
)
than the low-input conventional practice (278 and −114 US$ ha
−1
) in both seasons.
Higher-input conventional farming had a significantly higher cotton yield (CF-60 &
Table 6 Summary of mean daily values for weather parameters at the experiment site for the two
cotton growing seasons (Nov 2015 to Jun 2016, Oct 2016 to Jun 2017)
Season
RH
(%)
Temp
(°C)
Precipitation
(mm)
Solar
radiation
(W m
−2 )
Soil
VWC (m
3 m
−3 )
Soil WFPS
(%)
Soil
temp
(°C)
1 Mean 71 23.8
247
0.11
32.4
28.0
Min
23 20.7
0
211
0.05
15.3
23.8
Max 103 27.4
45
339
0.18
51.3
31.5
Total
759
2 Mean 54 24.6
259
0.11
32.7
29.4
Min
39 20.4
0
226
0.05
13.8
22.6
Max
75 28.5
48
438
0.21
63.0
35.5
Total
522
RH Relative humidity, VWC volumetric water content, WFPS water-filled pore space
T. N. Bwana et al.
3 Results
3.1 Weather Conditions in the Growing Seasons
The total rainfall recorded in the cotton growing season 1 (November 2015 to June
2016) was 759 mm, while that in season 2 (October 2016 to June 2017) was 522 mm
(Table 6). The rainfall recorded in season 1 was above the long-term (1994–2011)
annual rainfall mean of 668 mm (Kabote et al. 2013), while the rainfall in season 2
was below average.
The mean daily soil and air temperatures for seasons 1 and 2 were rather similar
(Fig. 2). There was slightly higher mean solar radiation in season 2 (226 W m
−2
)
than in season 1 (211 W m
−2
) and less soil moisture in season 2 than in season 1.
3.2 Yield and Economic Performance
The results regarding the yield and economic performance are summarised in
Table 7, whereas the most important results are visualised in Figs. 3, 4 and 5. The
weather conditions in the study area in season 1 (2015/16) were well suited for cotton production and resulted in relatively high cotton yields and a high profitability
of cotton production. In season 2, however, moisture stress at the end of the growing
season resulted in low yields and very poor economic performance.
The seed cotton yields in the two respective seasons in the currently practised
low-input conventional (CF-30 & CP-3: 1.27 and 0.37 Mg ha
−1
) and organic (OF-3
& OP-P: 1.37 and 0.63 Mg ha
−1
) farming were not significantly different. However,
the low-input organic practice had a higher land rent (LR) (524 and 139 US$ ha
−1
)
than the low-input conventional practice (278 and −114 US$ ha
−1
) in both seasons.
Higher-input conventional farming had a significantly higher cotton yield (CF-60 &
Table 6 Summary of mean daily values for weather parameters at the experiment site for the two
cotton growing seasons (Nov 2015 to Jun 2016, Oct 2016 to Jun 2017)
Season
RH
(%)
Temp
(°C)
Precipitation
(mm)
Solar
radiation
(W m
−2 )
Soil
VWC (m
3 m
−3 )
Soil WFPS
(%)
Soil
temp
(°C)
1 Mean 71 23.8
247
0.11
32.4
28.0
Min
23 20.7
0
211
0.05
15.3
23.8
Max 103 27.4
45
339
0.18
51.3
31.5
Total
759
2 Mean 54 24.6
259
0.11
32.7
29.4
Min
39 20.4
0
226
0.05
13.8
22.6
Max
75 28.5
48
438
0.21
63.0
35.5
Total
522
RH Relative humidity, VWC volumetric water content, WFPS water-filled pore space
T. N. Bwana et al.