

156
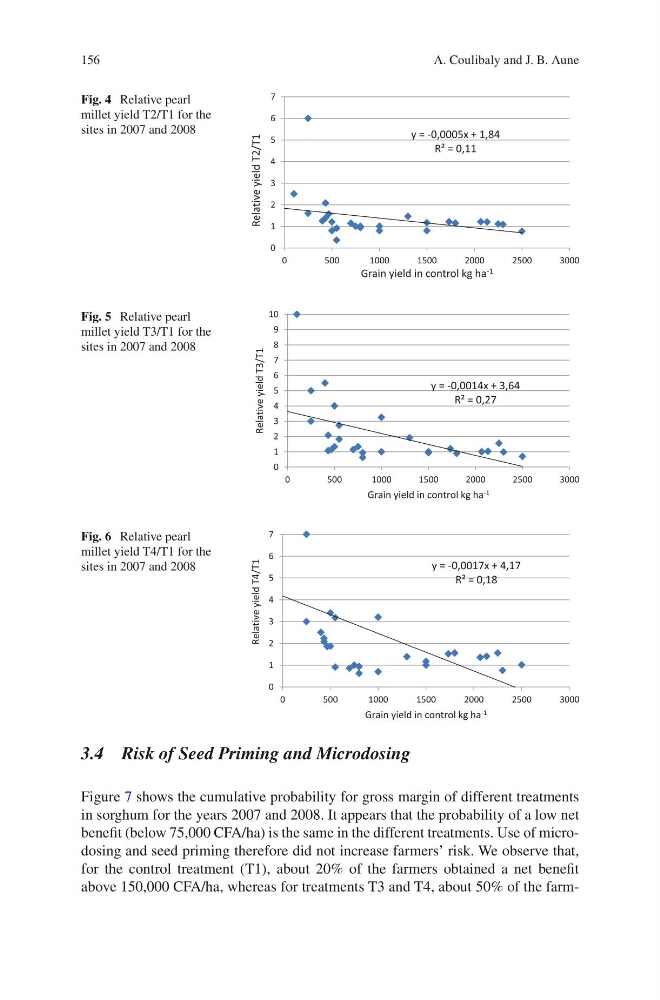
Fig. 4 Relative pearl
millet yield T2/T1 for the
sites in 2007 and 2008
Fig. 5 Relative pearl
millet yield T3/T1 for the
sites in 2007 and 2008
Fig. 6 Relative pearl
millet yield T4/T1 for the
sites in 2007 and 2008
3.4 Risk of Seed Priming and Microdosing
Figure 7 shows the cumulative probability for gross margin of different treatments
in sorghum for the years 2007 and 2008. It appears that the probability of a low net
benefit (below 75,000 CFA/ha) is the same in the different treatments. Use of microdosing and seed priming therefore did not increase farmers’ risk. We observe that,
for the control treatment (T1), about 20% of the farmers obtained a net benefit
above 150,000 CFA/ha, whereas for treatments T3 and T4, about 50% of the farmA. Coulibaly and J. B. Aune
Fig. 4 Relative pearl
millet yield T2/T1 for the
sites in 2007 and 2008
Fig. 5 Relative pearl
millet yield T3/T1 for the
sites in 2007 and 2008
Fig. 6 Relative pearl
millet yield T4/T1 for the
sites in 2007 and 2008
3.4 Risk of Seed Priming and Microdosing
Figure 7 shows the cumulative probability for gross margin of different treatments
in sorghum for the years 2007 and 2008. It appears that the probability of a low net
benefit (below 75,000 CFA/ha) is the same in the different treatments. Use of microdosing and seed priming therefore did not increase farmers’ risk. We observe that,
for the control treatment (T1), about 20% of the farmers obtained a net benefit
above 150,000 CFA/ha, whereas for treatments T3 and T4, about 50% of the farmA. Coulibaly and J. B. Aune