

120
2.4 Meteorological Data and Hydrological Analysis
Total rainfall volume for the catchment area obtained from the Department of
Climate Change and Meteorological Services was used to calculate SRO coefficient.
Using calculated total discharge, an annual hydrograph was produced in
Microsoft Excel to show the changes in streamflow discharge over a period of
10 months (Fig. 4). From this, baseflow was estimated using the “baseflow separation” technique (Brooks and Flolliott 2013). The estimated baseflow was then subtracted from total streamflow discharge (total Q) to give Qnet (m
3
/s). Since flow of
surface water tends to be higher than average flow, Qnet was corrected with a factor
of 0.75 (Brassington 1998).
Since the area under hydrograph after baseflow separation equals the total surface runoff volume in m
3
, the area under hydrograph was calculated using the trapezoidal method (Eq. 1).
A
a b h
=
+ ∗
2
(1)
where a and b are opposite sides of a trapezoid and h is height.
To depict total surface runoff volume for 24 hours, Eq. 2 was applied in
Microsoft Excel:
A
a b h
=
+
(
)
× × ×
2
24 60 60
(2)
Total surface runoff volume was divided by the total catchment area in m
2
to obtain
surface runoff depth in meters. Finally, the surface runoff depth was converted to
millimeters and divided by the total annual rainfall volume that fell in the catchment
area to obtain the SRO coefficient.
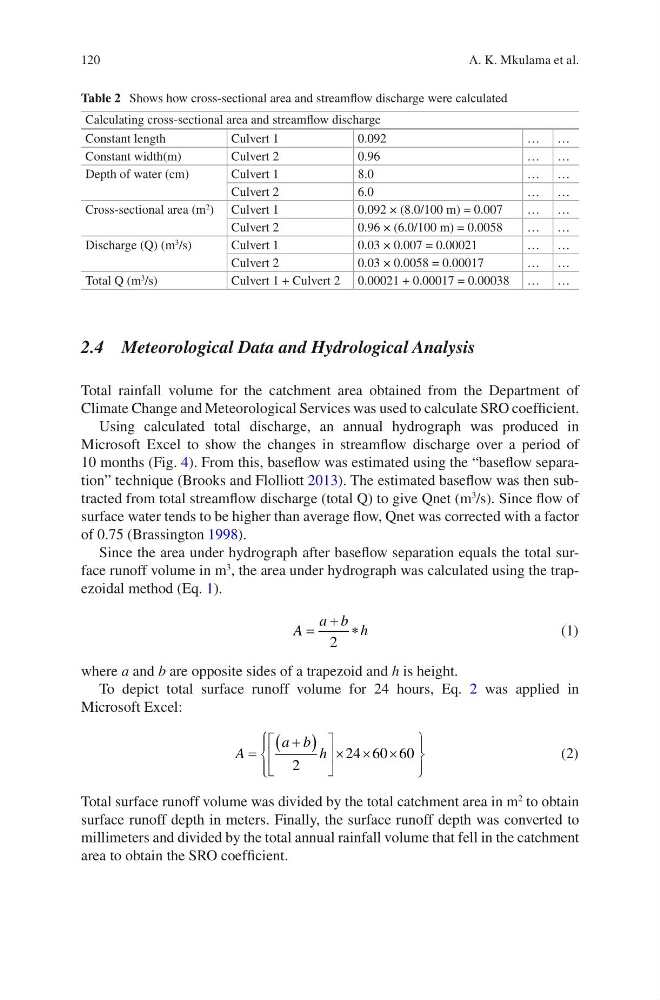
Table 2 Shows how cross-sectional area and streamflow discharge were calculated
Calculating cross-sectional area and streamflow discharge
Constant length
Culvert 1
0.092
… …
Constant width(m)
Culvert 2
0.96
… …
Depth of water (cm)
Culvert 1
8.0
… …
Culvert 2
6.0
… …
Cross-sectional area (m
2 ) Culvert 1
0.092 × (8.0/100 m) = 0.007
… …
Culvert 2
0.96 × (6.0/100 m) = 0.0058
… …
Discharge (Q) (m
3
/s)
Culvert 1
0.03 × 0.007 = 0.00021
… …
Culvert 2
0.03 × 0.0058 = 0.00017
… …
Total Q (m
3 /s)
Culvert 1 + Culvert 2 0.00021 + 0.00017 = 0.00038 … …
A. K. Mkulama et al.
2.4 Meteorological Data and Hydrological Analysis
Total rainfall volume for the catchment area obtained from the Department of
Climate Change and Meteorological Services was used to calculate SRO coefficient.
Using calculated total discharge, an annual hydrograph was produced in
Microsoft Excel to show the changes in streamflow discharge over a period of
10 months (Fig. 4). From this, baseflow was estimated using the “baseflow separation” technique (Brooks and Flolliott 2013). The estimated baseflow was then subtracted from total streamflow discharge (total Q) to give Qnet (m
3
/s). Since flow of
surface water tends to be higher than average flow, Qnet was corrected with a factor
of 0.75 (Brassington 1998).
Since the area under hydrograph after baseflow separation equals the total surface runoff volume in m
3
, the area under hydrograph was calculated using the trapezoidal method (Eq. 1).
A
a b h
=
+ ∗
2
(1)
where a and b are opposite sides of a trapezoid and h is height.
To depict total surface runoff volume for 24 hours, Eq. 2 was applied in
Microsoft Excel:
A
a b h
=
+
(
)
× × ×
2
24 60 60
(2)
Total surface runoff volume was divided by the total catchment area in m
2
to obtain
surface runoff depth in meters. Finally, the surface runoff depth was converted to
millimeters and divided by the total annual rainfall volume that fell in the catchment
area to obtain the SRO coefficient.
Table 2 Shows how cross-sectional area and streamflow discharge were calculated
Calculating cross-sectional area and streamflow discharge
Constant length
Culvert 1
0.092
… …
Constant width(m)
Culvert 2
0.96
… …
Depth of water (cm)
Culvert 1
8.0
… …
Culvert 2
6.0
… …
Cross-sectional area (m
2 ) Culvert 1
0.092 × (8.0/100 m) = 0.007
… …
Culvert 2
0.96 × (6.0/100 m) = 0.0058
… …
Discharge (Q) (m
3
/s)
Culvert 1
0.03 × 0.007 = 0.00021
… …
Culvert 2
0.03 × 0.0058 = 0.00017
… …
Total Q (m
3 /s)
Culvert 1 + Culvert 2 0.00021 + 0.00017 = 0.00038 … …
A. K. Mkulama et al.