

119
at the wetland outlet was selected based on the stream configuration and scientific
recommendations,
2
along which fluctuating average water levels (stage) were measured using a steel tape in centimeters.
Water velocities were estimated by timing a float over a distance of 1.3 m as
per recommendation.
3
Measurements were repeated five times, with the float
placed at different distances along the section to correct potential human errors
such as reading of the digital time. The average time was then calculated in seconds (s) and divided into the measured distance to give average velocity in meters
per second (m/s).
To determine cross-sectional area of the stream, a steel tape was used to measure
length and width of the two rectangular culverts located at the wetland outlet. The
product of these values gave the constant cross-sectional area of the stream in square
meters (m
2
). Furthermore, for each culvert and on each day, the cross-sectional area
was calculated by multiplying the average stage or depth of the water in meters with
the culvert width measured earlier. In fact, wetland flows were the product of the
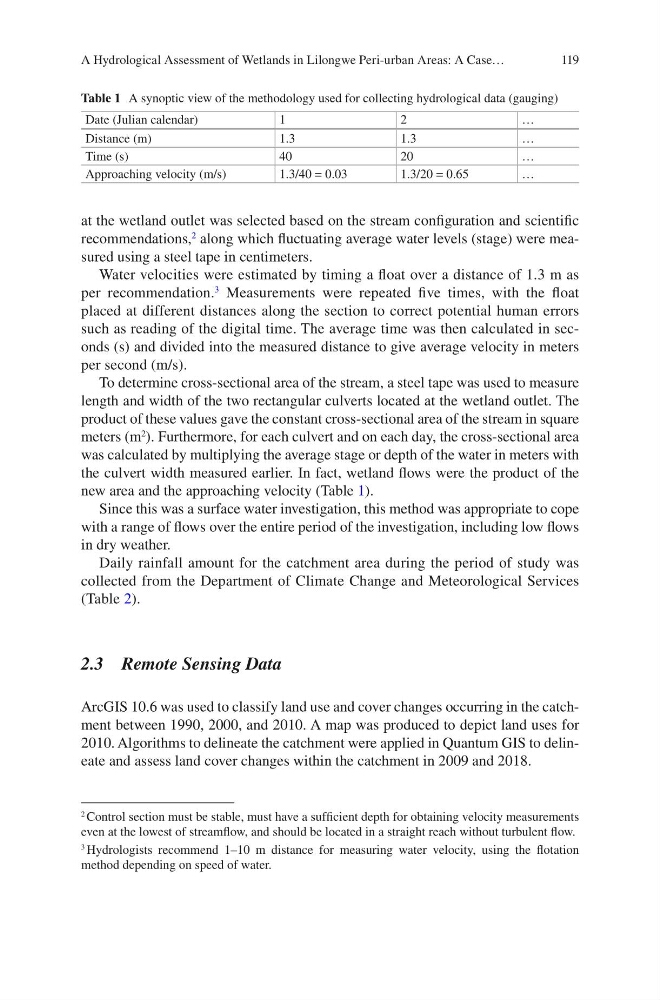
new area and the approaching velocity (Table 1).
Since this was a surface water investigation, this method was appropriate to cope
with a range of flows over the entire period of the investigation, including low flows
in dry weather.
Daily rainfall amount for the catchment area during the period of study was
collected from the Department of Climate Change and Meteorological Services
(Table 2).
2.3 Remote Sensing Data
ArcGIS 10.6 was used to classify land use and cover changes occurring in the catchment between 1990, 2000, and 2010. A map was produced to depict land uses for
2010. Algorithms to delineate the catchment were applied in Quantum GIS to delineate and assess land cover changes within the catchment in 2009 and 2018.
2 Control section must be stable, must have a sufficient depth for obtaining velocity measurements
even at the lowest of streamflow, and should be located in a straight reach without turbulent flow.
3 Hydrologists recommend 1–10 m distance for measuring water velocity, using the flotation
method depending on speed of water.
Table 1 A synoptic view of the methodology used for collecting hydrological data (gauging)
Date (Julian calendar)
1
2
…
Distance (m)
1.3
1.3
…
Time (s)
40
20
…
Approaching velocity (m/s)
1.3/40 = 0.03
1.3/20 = 0.65
…
A Hydrological Assessment of Wetlands in Lilongwe Peri-urban Areas: A Case…
at the wetland outlet was selected based on the stream configuration and scientific
recommendations,
2
along which fluctuating average water levels (stage) were measured using a steel tape in centimeters.
Water velocities were estimated by timing a float over a distance of 1.3 m as
per recommendation.
3
Measurements were repeated five times, with the float
placed at different distances along the section to correct potential human errors
such as reading of the digital time. The average time was then calculated in seconds (s) and divided into the measured distance to give average velocity in meters
per second (m/s).
To determine cross-sectional area of the stream, a steel tape was used to measure
length and width of the two rectangular culverts located at the wetland outlet. The
product of these values gave the constant cross-sectional area of the stream in square
meters (m
2
). Furthermore, for each culvert and on each day, the cross-sectional area
was calculated by multiplying the average stage or depth of the water in meters with
the culvert width measured earlier. In fact, wetland flows were the product of the
new area and the approaching velocity (Table 1).
Since this was a surface water investigation, this method was appropriate to cope
with a range of flows over the entire period of the investigation, including low flows
in dry weather.
Daily rainfall amount for the catchment area during the period of study was
collected from the Department of Climate Change and Meteorological Services
(Table 2).
2.3 Remote Sensing Data
ArcGIS 10.6 was used to classify land use and cover changes occurring in the catchment between 1990, 2000, and 2010. A map was produced to depict land uses for
2010. Algorithms to delineate the catchment were applied in Quantum GIS to delineate and assess land cover changes within the catchment in 2009 and 2018.
2 Control section must be stable, must have a sufficient depth for obtaining velocity measurements
even at the lowest of streamflow, and should be located in a straight reach without turbulent flow.
3 Hydrologists recommend 1–10 m distance for measuring water velocity, using the flotation
method depending on speed of water.
Table 1 A synoptic view of the methodology used for collecting hydrological data (gauging)
Date (Julian calendar)
1
2
…
Distance (m)
1.3
1.3
…
Time (s)
40
20
…
Approaching velocity (m/s)
1.3/40 = 0.03
1.3/20 = 0.65
…
A Hydrological Assessment of Wetlands in Lilongwe Peri-urban Areas: A Case…