

104
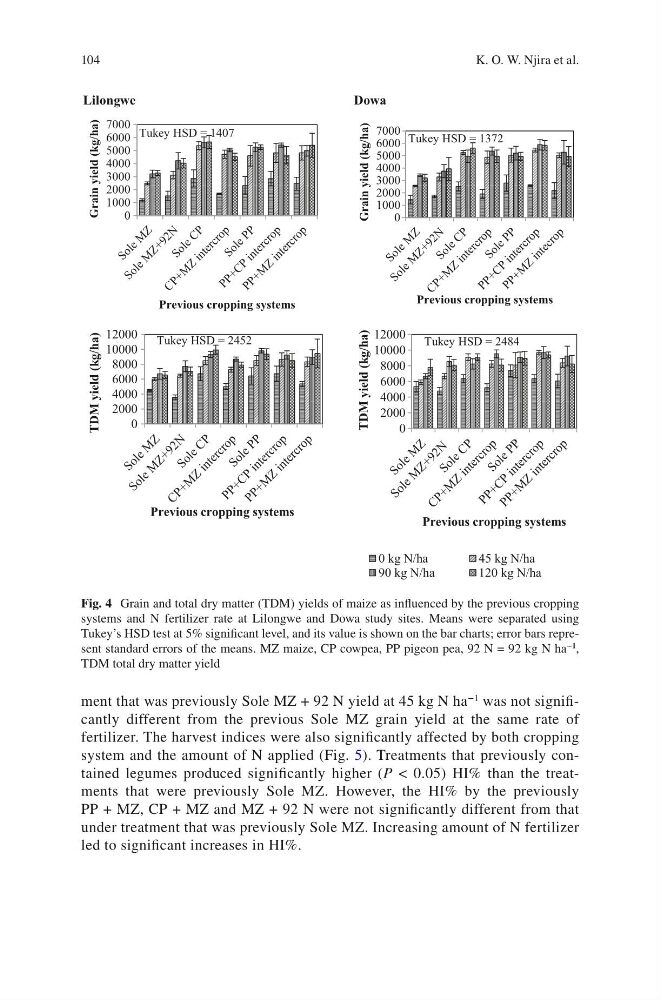
ment that was previously Sole MZ + 92 N yield at 45 kg N ha
−1
was not significantly different from the previous Sole MZ grain yield at the same rate of
fertilizer. The harvest indices were also significantly affected by both cropping
system and the amount of N applied (Fig. 5). Treatments that previously contained legumes produced significantly higher (P < 0.05) HI% than the treatments that were previously Sole MZ. However, the HI% by the previously
PP + MZ, CP + MZ and MZ + 92 N were not significantly different from that
under treatment that was previously Sole MZ. Increasing amount of N fertilizer
led to significant increases in HI%.
Lilongwe
Dowa
0
1000
2000
3000
4000
5000
6000
7000
Grain yield (kg/ha)
Previous cropping systems
Tukey HSD = 1407
0
1000
2000
3000
4000
5000
6000
7000
Grain yield (kg/ha)
Previous cropping systems
Tukey HSD = 1372
0
2000
4000
6000
8000
10000
12000
TDM yield (kg/ha)
Previous cropping systems
Tukey HSD = 2452
0
2000
4000
6000
8000
10000
12000
TDM yield (kg/ha)
Previous cropping systems
0 kg N/ha
45 kg N/ha
90 kg N/ha
120 kg N/ha
Tukey HSD = 2484
Fig. 4 Grain and total dry matter (TDM) yields of maize as influenced by the previous cropping
systems and N fertilizer rate at Lilongwe and Dowa study sites. Means were separated using
Tukey’s HSD test at 5% significant level, and its value is shown on the bar charts; error bars represent standard errors of the means. MZ maize, CP cowpea, PP pigeon pea, 92 N = 92 kg N ha
−1 ,
TDM total dry matter yield
K. O. W. Njira et al.
ment that was previously Sole MZ + 92 N yield at 45 kg N ha
−1
was not significantly different from the previous Sole MZ grain yield at the same rate of
fertilizer. The harvest indices were also significantly affected by both cropping
system and the amount of N applied (Fig. 5). Treatments that previously contained legumes produced significantly higher (P < 0.05) HI% than the treatments that were previously Sole MZ. However, the HI% by the previously
PP + MZ, CP + MZ and MZ + 92 N were not significantly different from that
under treatment that was previously Sole MZ. Increasing amount of N fertilizer
led to significant increases in HI%.
Lilongwe
Dowa
0
1000
2000
3000
4000
5000
6000
7000
Grain yield (kg/ha)
Previous cropping systems
Tukey HSD = 1407
0
1000
2000
3000
4000
5000
6000
7000
Grain yield (kg/ha)
Previous cropping systems
Tukey HSD = 1372
0
2000
4000
6000
8000
10000
12000
TDM yield (kg/ha)
Previous cropping systems
Tukey HSD = 2452
0
2000
4000
6000
8000
10000
12000
TDM yield (kg/ha)
Previous cropping systems
0 kg N/ha
45 kg N/ha
90 kg N/ha
120 kg N/ha
Tukey HSD = 2484
Fig. 4 Grain and total dry matter (TDM) yields of maize as influenced by the previous cropping
systems and N fertilizer rate at Lilongwe and Dowa study sites. Means were separated using
Tukey’s HSD test at 5% significant level, and its value is shown on the bar charts; error bars represent standard errors of the means. MZ maize, CP cowpea, PP pigeon pea, 92 N = 92 kg N ha
−1 ,
TDM total dry matter yield
K. O. W. Njira et al.