

103
N rates of 45, 90 and 120 kg N ha
−1
, which, amongst themselves, were not significantly different. The previous legume-based systems produced significantly
higher (P < 0.05) grain yields than the previous Sole MZ by a range of 30%
under previous CP + MZ intercrop to 59% under previous Sole CP at 0 kg N ha
−1
fertilizer application. Similarly, at the highest rate of N application, 120 kg N ha
−1
,
the previous legume-based treatments were significantly higher (P < 0.05) than
the previous Sole MZ by a range of 28% under previous CP + MZ intercrop to
42% under previous Sole CP. The TDM yields followed a similar trend.
Furthermore, HI% by the treatments on the previous Sole MZ was significantly
lower than the rest of the cropping systems (Fig. 5). Additionally, significant differences (P < 0.05) in HI% were also observed as influenced by the rate of N
applied for the Lilongwe site.
Maize grain yields for the Dowa site were significantly different (P < 0.05)
as influenced by both cropping system and fertilizer N rate applied. Treatments
that were previously legume-based showed significantly higher (P < 0.01) grain
yields than those that were previously Sole MZ at all rates of N fertilizer applied.
At the 0 kg N ha
−1
, they were significantly higher (P < 0.05) by a range of 24%
under treatment that was previously CP + MZ intercrop to 48% under the treatment that was previously Sole PP, whereas at the 120 kg N ha
−1
, they were significantly higher (P < 0.05) by a range of 35% under previous PP + MZ intercrop
to 45% under treatment that was previously PP + CP. On the other hand, the
previously Sole MZ + 92 N treatment yields were not significantly different
from the legume-based plots’ yields at 120 kg N ha
−1
. Furthermore, the treatLilongwe
Dowa
0
50
100
150
200
250
N uptake (kg/ha)
Previous cropping systems
Tukey HSD = 46.9
0
50
100
150
200
250
300
N uptake (kg/ha)
Previous cropping systems
0 kg N/ha
45 kg N/ha
90 kg N/ha
120 kg N/ha
Tukey HSD = 77.5
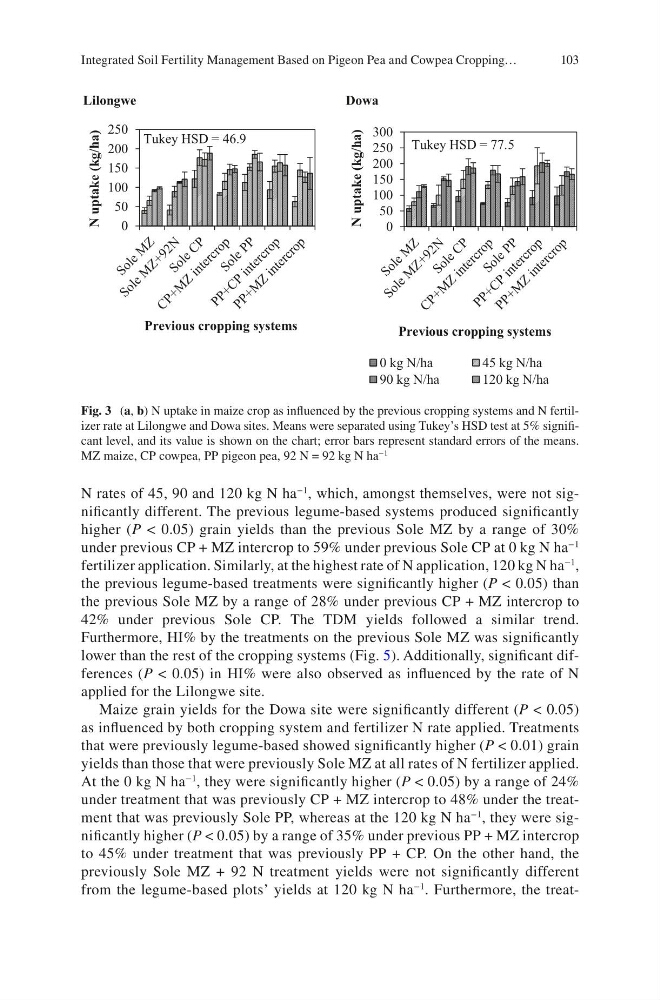
Fig. 3 (a, b) N uptake in maize crop as influenced by the previous cropping systems and N fertilizer rate at Lilongwe and Dowa sites. Means were separated using Tukey’s HSD test at 5% significant level, and its value is shown on the chart; error bars represent standard errors of the means.
MZ maize, CP cowpea, PP pigeon pea, 92 N = 92 kg N ha
−1
Integrated Soil Fertility Management Based on Pigeon Pea and Cowpea Cropping…
N rates of 45, 90 and 120 kg N ha
−1
, which, amongst themselves, were not significantly different. The previous legume-based systems produced significantly
higher (P < 0.05) grain yields than the previous Sole MZ by a range of 30%
under previous CP + MZ intercrop to 59% under previous Sole CP at 0 kg N ha
−1
fertilizer application. Similarly, at the highest rate of N application, 120 kg N ha
−1
,
the previous legume-based treatments were significantly higher (P < 0.05) than
the previous Sole MZ by a range of 28% under previous CP + MZ intercrop to
42% under previous Sole CP. The TDM yields followed a similar trend.
Furthermore, HI% by the treatments on the previous Sole MZ was significantly
lower than the rest of the cropping systems (Fig. 5). Additionally, significant differences (P < 0.05) in HI% were also observed as influenced by the rate of N
applied for the Lilongwe site.
Maize grain yields for the Dowa site were significantly different (P < 0.05)
as influenced by both cropping system and fertilizer N rate applied. Treatments
that were previously legume-based showed significantly higher (P < 0.01) grain
yields than those that were previously Sole MZ at all rates of N fertilizer applied.
At the 0 kg N ha
−1
, they were significantly higher (P < 0.05) by a range of 24%
under treatment that was previously CP + MZ intercrop to 48% under the treatment that was previously Sole PP, whereas at the 120 kg N ha
−1
, they were significantly higher (P < 0.05) by a range of 35% under previous PP + MZ intercrop
to 45% under treatment that was previously PP + CP. On the other hand, the
previously Sole MZ + 92 N treatment yields were not significantly different
from the legume-based plots’ yields at 120 kg N ha
−1
. Furthermore, the treatLilongwe
Dowa
0
50
100
150
200
250
N uptake (kg/ha)
Previous cropping systems
Tukey HSD = 46.9
0
50
100
150
200
250
300
N uptake (kg/ha)
Previous cropping systems
0 kg N/ha
45 kg N/ha
90 kg N/ha
120 kg N/ha
Tukey HSD = 77.5
Fig. 3 (a, b) N uptake in maize crop as influenced by the previous cropping systems and N fertilizer rate at Lilongwe and Dowa sites. Means were separated using Tukey’s HSD test at 5% significant level, and its value is shown on the chart; error bars represent standard errors of the means.
MZ maize, CP cowpea, PP pigeon pea, 92 N = 92 kg N ha
−1
Integrated Soil Fertility Management Based on Pigeon Pea and Cowpea Cropping…