

294
6. The electrolysis starts and the chronoamperometric curve
(current vs. time) is recorded to monitor the process.
7. Collect the aliquots of electrolyzed solution during and at the
end of the electrolysis at different time intervals, corresponding to the number of electrons involved in the process z = 1,
z = 2, etc., which can be calculated accordingly to Faraday’s
laws (see Note 5). Directly transfer the aliquots by syringe to
suitable vials and directly inject in the HPLC-DAD or
HPLC- MS/MS systems to analyze the products formed by
oxidative or reductive electrolysis.
8. Collect samples during and after electrolysis and store at
−18 °C for further analysis using chromatographic techniques
as GC–MS.
9. Stop electrolysis when current values reach a plateau. Calculate
the number of electrons participating in the redox process
from the charge consumed during the electrolysis using
Faraday’s laws (see Note 5).
10. Mount the working electrode used for cyclic voltammetry on
the cell. Record the cyclic voltammogram of the solution after
the electrolysis and compare with that of drug solution before
the electrolysis.
1. Evaporate an aliquot of the sample containing quercetin and its
possible electrolysis products in the presence or absence of
cyclodextrin (Fig. 4).
2. Add 10 μL of 2,4-dihydroxybenzophenone (solution in isopropanol; internal standard IS1) to the extract and evaporate.
3.3 Identification
of Products
3.3.1 GC-MS
Chromatography
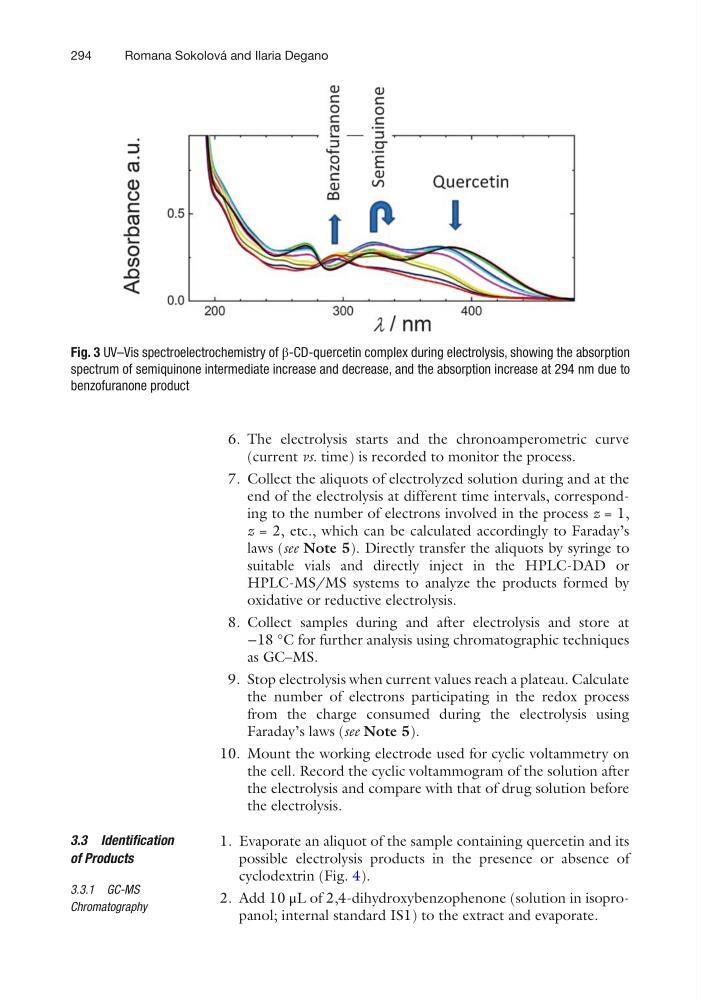
Fig. 3 UV–Vis spectroelectrochemistry of β-CD-quercetin complex during electrolysis, showing the absorption
spectrum of semiquinone intermediate increase and decrease, and the absorption increase at 294 nm due to
benzofuranone product
Romana Sokolová and Ilaria Degano
6. The electrolysis starts and the chronoamperometric curve
(current vs. time) is recorded to monitor the process.
7. Collect the aliquots of electrolyzed solution during and at the
end of the electrolysis at different time intervals, corresponding to the number of electrons involved in the process z = 1,
z = 2, etc., which can be calculated accordingly to Faraday’s
laws (see Note 5). Directly transfer the aliquots by syringe to
suitable vials and directly inject in the HPLC-DAD or
HPLC- MS/MS systems to analyze the products formed by
oxidative or reductive electrolysis.
8. Collect samples during and after electrolysis and store at
−18 °C for further analysis using chromatographic techniques
as GC–MS.
9. Stop electrolysis when current values reach a plateau. Calculate
the number of electrons participating in the redox process
from the charge consumed during the electrolysis using
Faraday’s laws (see Note 5).
10. Mount the working electrode used for cyclic voltammetry on
the cell. Record the cyclic voltammogram of the solution after
the electrolysis and compare with that of drug solution before
the electrolysis.
1. Evaporate an aliquot of the sample containing quercetin and its
possible electrolysis products in the presence or absence of
cyclodextrin (Fig. 4).
2. Add 10 μL of 2,4-dihydroxybenzophenone (solution in isopropanol; internal standard IS1) to the extract and evaporate.
3.3 Identification
of Products
3.3.1 GC-MS
Chromatography
Fig. 3 UV–Vis spectroelectrochemistry of β-CD-quercetin complex during electrolysis, showing the absorption
spectrum of semiquinone intermediate increase and decrease, and the absorption increase at 294 nm due to
benzofuranone product
Romana Sokolová and Ilaria Degano