

Assessment of Sustainability Elements in Forestry Department …
843
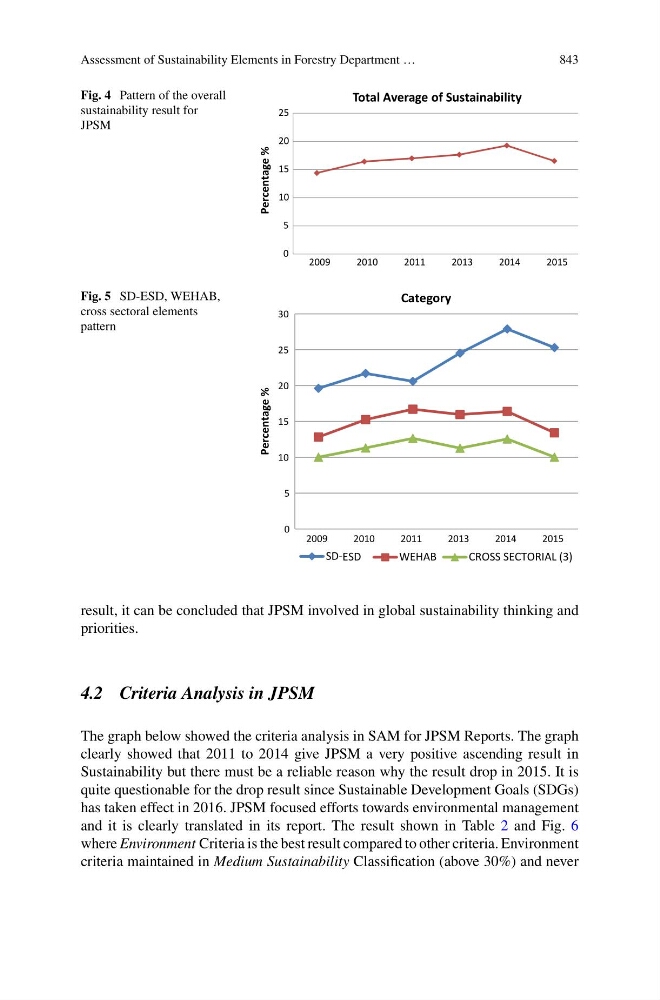
Fig. 4 Pattern of the overall
sustainability result for
JPSM
0
5
10
15
20
25
2009
2010
2011
2013
2014
2015
Percentage %
Total Average of Sustainability
Fig. 5 SD-ESD, WEHAB,
cross sectoral elements
pattern
0
5
10
15
20
25
30
2009
2010
2011
2013
2014
2015
Percentage %
Category
SD-ESD
WEHAB
CROSS SECTORIAL (3)
result, it can be concluded that JPSM involved in global sustainability thinking and
priorities.
4.2 Criteria Analysis in JPSM
The graph below showed the criteria analysis in SAM for JPSM Reports. The graph
clearly showed that 2011 to 2014 give JPSM a very positive ascending result in
Sustainability but there must be a reliable reason why the result drop in 2015. It is
quite questionable for the drop result since Sustainable Development Goals (SDGs)
has taken effect in 2016. JPSM focused efforts towards environmental management
and it is clearly translated in its report. The result shown in Table 2 and Fig. 6
where Environment Criteria is the best result compared to other criteria. Environment
criteria maintained in Medium Sustainability Classification (above 30%) and never
843
Fig. 4 Pattern of the overall
sustainability result for
JPSM
0
5
10
15
20
25
2009
2010
2011
2013
2014
2015
Percentage %
Total Average of Sustainability
Fig. 5 SD-ESD, WEHAB,
cross sectoral elements
pattern
0
5
10
15
20
25
30
2009
2010
2011
2013
2014
2015
Percentage %
Category
SD-ESD
WEHAB
CROSS SECTORIAL (3)
result, it can be concluded that JPSM involved in global sustainability thinking and
priorities.
4.2 Criteria Analysis in JPSM
The graph below showed the criteria analysis in SAM for JPSM Reports. The graph
clearly showed that 2011 to 2014 give JPSM a very positive ascending result in
Sustainability but there must be a reliable reason why the result drop in 2015. It is
quite questionable for the drop result since Sustainable Development Goals (SDGs)
has taken effect in 2016. JPSM focused efforts towards environmental management
and it is clearly translated in its report. The result shown in Table 2 and Fig. 6
where Environment Criteria is the best result compared to other criteria. Environment
criteria maintained in Medium Sustainability Classification (above 30%) and never