

Sustainable Practices for the Organic Waste Management …
815
Table 2 Results’ distribution of waste sampling
Week 1
Week 2
Average
(kg/day)
Standard
deviation
Days of
week
(kg/day) Number of
meals
(kg/day) Number of
meals
Monday
22.58
135
22.00
136
22.29
0.41
Tuesday
22.92
176
25.22
146
24.07
1.63
Wednesday
22.75
168
25.54
148
24.145
1.97
Thursday
27.70
164
19.68
147
23.69
5.67
Friday
20.18
135
26.14
130
23.16
4.21
Total
116.13
778
118.58
707
–
–
Average
23.24
156
23.77
141
–
–
Standard
deviation
2.74
19.30
2.77
7.96
–
–
General
total
(During
2 weeks)
Total of waste (kg)
Number of meals
Average
(kg/day)
Standard
deviation
234.71
1485
23.47
2.61
Source Prepared by the authors
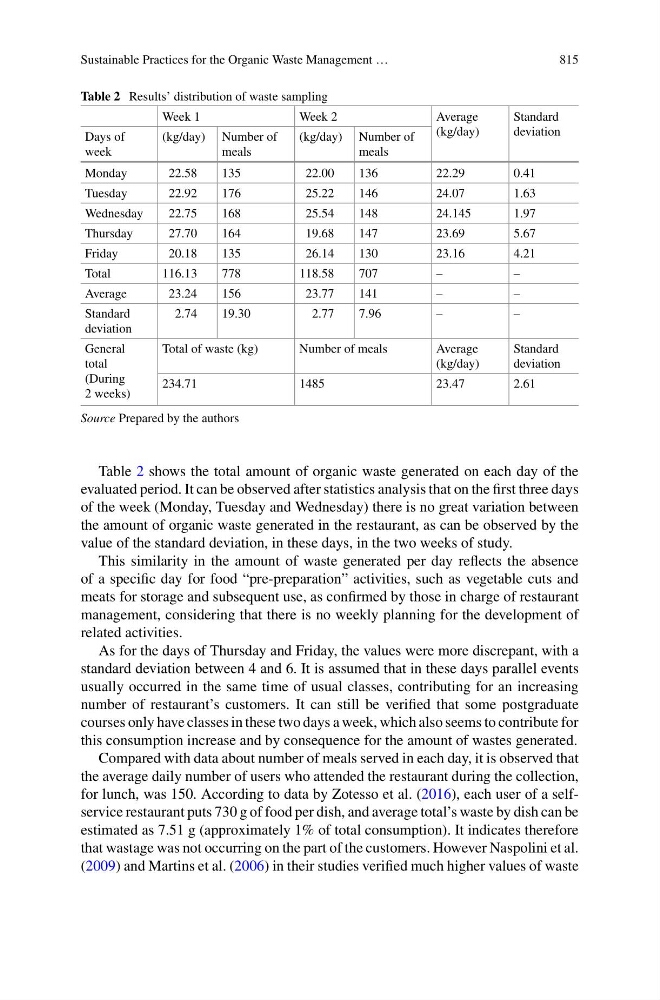
Table 2 shows the total amount of organic waste generated on each day of the
evaluated period. It can be observed after statistics analysis that on the first three days
of the week (Monday, Tuesday and Wednesday) there is no great variation between
the amount of organic waste generated in the restaurant, as can be observed by the
value of the standard deviation, in these days, in the two weeks of study.
This similarity in the amount of waste generated per day reflects the absence
of a specific day for food “pre-preparation” activities, such as vegetable cuts and
meats for storage and subsequent use, as confirmed by those in charge of restaurant
management, considering that there is no weekly planning for the development of
related activities.
As for the days of Thursday and Friday, the values were more discrepant, with a
standard deviation between 4 and 6. It is assumed that in these days parallel events
usually occurred in the same time of usual classes, contributing for an increasing
number of restaurant’s customers. It can still be verified that some postgraduate
courses only have classes in these two days a week, which also seems to contribute for
this consumption increase and by consequence for the amount of wastes generated.
Compared with data about number of meals served in each day, it is observed that
the average daily number of users who attended the restaurant during the collection,
for lunch, was 150. According to data by Zotesso et al. (2016), each user of a selfservice restaurant puts 730 g of food per dish, and average total’s waste by dish can be
estimated as 7.51 g (approximately 1% of total consumption). It indicates therefore
that wastage was not occurring on the part of the customers. However Naspolini et al.
(2009) and Martins et al. (2006) in their studies verified much higher values of waste