

A Survey of Laboratory Practice on Water Scarcity: Conservation …
767
Table 2 Water consumption by distillation process in research labs of five schools of sciences in
USM per month
School
Hours per working day No. Distiller
Water drained (L)
Physics
6
2
65033.28
Pharmaceutical sciences 6
22
715366.08
Industrial technology
6
15
487749.60
Biological sciences
4
18
390199.68
Chemical sciences
4
23
498588.48
Institute for research in
molecular medicine
6
2
65033.28
Physics
6
2
65033.28
Total
32
82
2,221,970.40
(586982.48 gallons)
from the respondents. The obtained time was used to approximate the total amount
of waste water generated from the water distiller per month that has been drained.
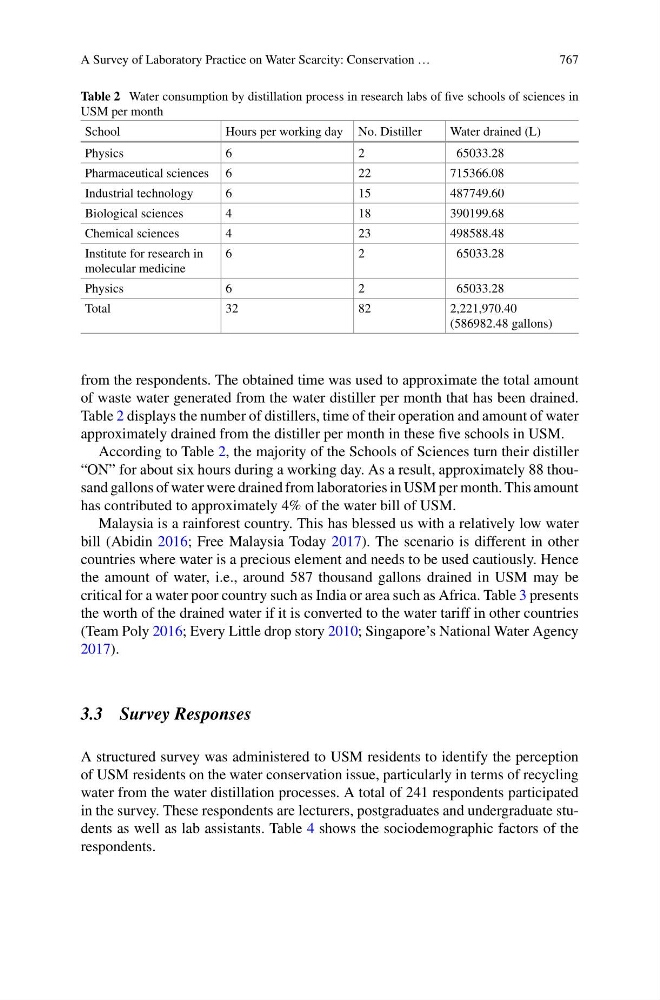
Table 2 displays the number of distillers, time of their operation and amount of water
approximately drained from the distiller per month in these five schools in USM.
According to Table 2, the majority of the Schools of Sciences turn their distiller
“ON” for about six hours during a working day. As a result, approximately 88 thousand gallons of water were drained from laboratories in USM per month. This amount
has contributed to approximately 4% of the water bill of USM.
Malaysia is a rainforest country. This has blessed us with a relatively low water
bill (Abidin 2016; Free Malaysia Today 2017). The scenario is different in other
countries where water is a precious element and needs to be used cautiously. Hence
the amount of water, i.e., around 587 thousand gallons drained in USM may be
critical for a water poor country such as India or area such as Africa. Table 3 presents
the worth of the drained water if it is converted to the water tariff in other countries
(Team Poly 2016; Every Little drop story 2010; Singapore’s National Water Agency
2017).
3.3 Survey Responses
A structured survey was administered to USM residents to identify the perception
of USM residents on the water conservation issue, particularly in terms of recycling
water from the water distillation processes. A total of 241 respondents participated
in the survey. These respondents are lecturers, postgraduates and undergraduate students as well as lab assistants. Table 4 shows the sociodemographic factors of the
respondents.