

A Survey of Laboratory Practice on Water Scarcity: Conservation …
765
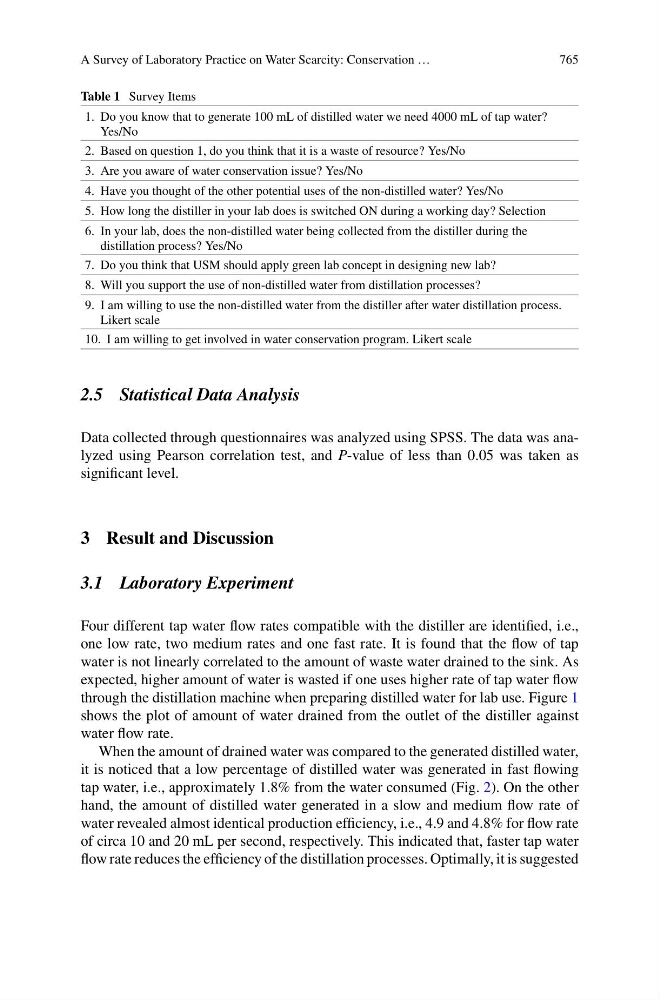
Table 1 Survey Items
1. Do you know that to generate 100 mL of distilled water we need 4000 mL of tap water?
Yes/No
2. Based on question 1, do you think that it is a waste of resource? Yes/No
3. Are you aware of water conservation issue? Yes/No
4. Have you thought of the other potential uses of the non-distilled water? Yes/No
5. How long the distiller in your lab does is switched ON during a working day? Selection
6. In your lab, does the non-distilled water being collected from the distiller during the
distillation process? Yes/No
7. Do you think that USM should apply green lab concept in designing new lab?
8. Will you support the use of non-distilled water from distillation processes?
9. I am willing to use the non-distilled water from the distiller after water distillation process.
Likert scale
10. I am willing to get involved in water conservation program. Likert scale
2.5 Statistical Data Analysis
Data collected through questionnaires was analyzed using SPSS. The data was analyzed using Pearson correlation test, and P-value of less than 0.05 was taken as
significant level.
3 Result and Discussion
3.1 Laboratory Experiment
Four different tap water flow rates compatible with the distiller are identified, i.e.,
one low rate, two medium rates and one fast rate. It is found that the flow of tap
water is not linearly correlated to the amount of waste water drained to the sink. As
expected, higher amount of water is wasted if one uses higher rate of tap water flow
through the distillation machine when preparing distilled water for lab use. Figure 1
shows the plot of amount of water drained from the outlet of the distiller against
water flow rate.
When the amount of drained water was compared to the generated distilled water,
it is noticed that a low percentage of distilled water was generated in fast flowing
tap water, i.e., approximately 1.8% from the water consumed (Fig. 2). On the other
hand, the amount of distilled water generated in a slow and medium flow rate of
water revealed almost identical production efficiency, i.e., 4.9 and 4.8% for flow rate
of circa 10 and 20 mL per second, respectively. This indicated that, faster tap water
flow rate reduces the efficiency of the distillation processes. Optimally, it is suggested