

56
L. L. Brandli et al.
0
10
20
30
40
50
60
70
0
5
10
15
20
25
Percentage (%)
Number of respondents
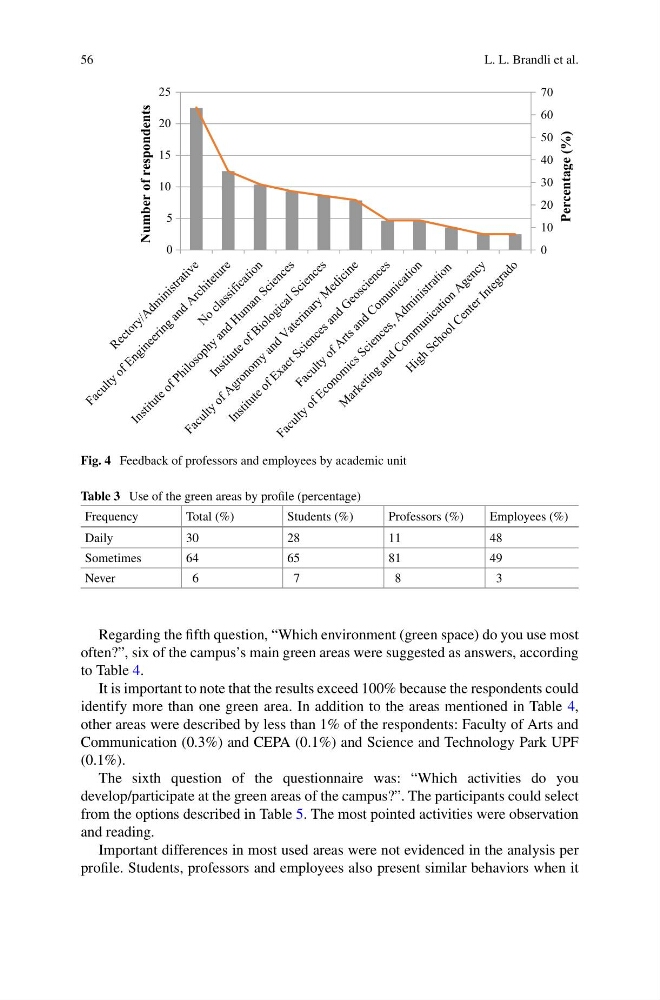
Fig. 4 Feedback of professors and employees by academic unit
Table 3 Use of the green areas by profile (percentage)
Frequency
Total (%)
Students (%)
Professors (%)
Employees (%)
Daily
30
28
11
48
Sometimes
64
65
81
49
Never
6
7
8
3
Regarding the fifth question, “Which environment (green space) do you use most
often?”, six of the campus’s main green areas were suggested as answers, according
to Table 4.
It is important to note that the results exceed 100% because the respondents could
identify more than one green area. In addition to the areas mentioned in Table 4,
other areas were described by less than 1% of the respondents: Faculty of Arts and
Communication (0.3%) and CEPA (0.1%) and Science and Technology Park UPF
(0.1%).
The sixth question of the questionnaire was: “Which activities do you
develop/participate at the green areas of the campus?”. The participants could select
from the options described in Table 5. The most pointed activities were observation
and reading.
Important differences in most used areas were not evidenced in the analysis per
profile. Students, professors and employees also present similar behaviors when it
L. L. Brandli et al.
0
10
20
30
40
50
60
70
0
5
10
15
20
25
Percentage (%)
Number of respondents
Fig. 4 Feedback of professors and employees by academic unit
Table 3 Use of the green areas by profile (percentage)
Frequency
Total (%)
Students (%)
Professors (%)
Employees (%)
Daily
30
28
11
48
Sometimes
64
65
81
49
Never
6
7
8
3
Regarding the fifth question, “Which environment (green space) do you use most
often?”, six of the campus’s main green areas were suggested as answers, according
to Table 4.
It is important to note that the results exceed 100% because the respondents could
identify more than one green area. In addition to the areas mentioned in Table 4,
other areas were described by less than 1% of the respondents: Faculty of Arts and
Communication (0.3%) and CEPA (0.1%) and Science and Technology Park UPF
(0.1%).
The sixth question of the questionnaire was: “Which activities do you
develop/participate at the green areas of the campus?”. The participants could select
from the options described in Table 5. The most pointed activities were observation
and reading.
Important differences in most used areas were not evidenced in the analysis per
profile. Students, professors and employees also present similar behaviors when it