

Waste Management—A Case Study in Nepal
189
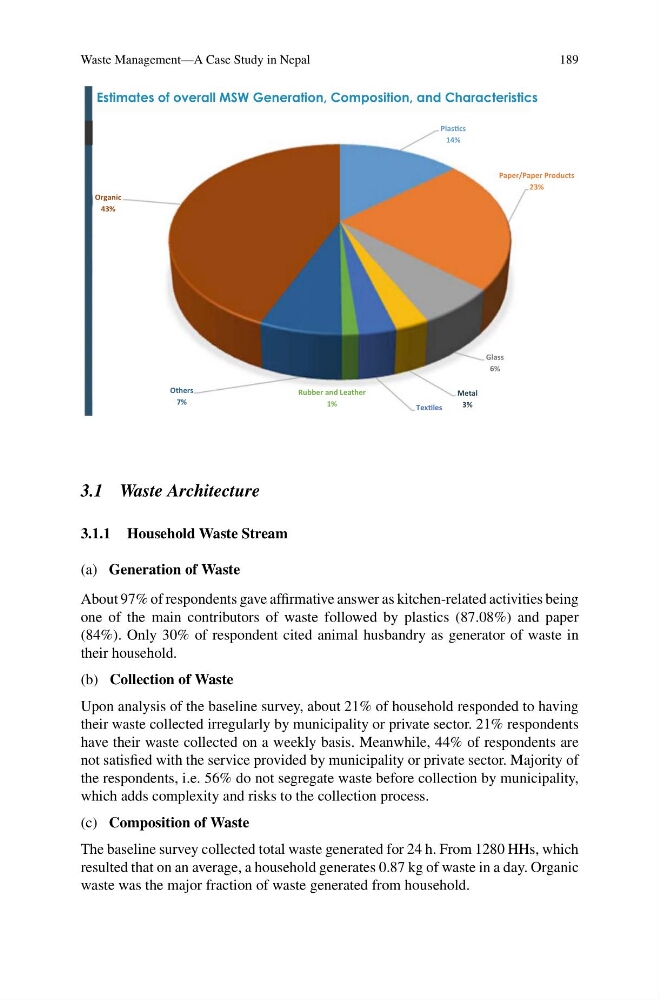
Estimates of overall MSW Generation, Composition, and Characteristics
PlasƟcs
14%
Paper/Paper Products
23%
Glass
6%
Metal
3%
TexƟles
Rubber and Leather
1%
Others
7%
Organic
43%
3.1 Waste Architecture
3.1.1 Household Waste Stream
(a) Generation of Waste
About 97% of respondents gave affirmative answer as kitchen-related activities being
one of the main contributors of waste followed by plastics (87.08%) and paper
(84%). Only 30% of respondent cited animal husbandry as generator of waste in
their household.
(b) Collection of Waste
Upon analysis of the baseline survey, about 21% of household responded to having
their waste collected irregularly by municipality or private sector. 21% respondents
have their waste collected on a weekly basis. Meanwhile, 44% of respondents are
not satisfied with the service provided by municipality or private sector. Majority of
the respondents, i.e. 56% do not segregate waste before collection by municipality,
which adds complexity and risks to the collection process.
(c) Composition of Waste
The baseline survey collected total waste generated for 24 h. From 1280 HHs, which
resulted that on an average, a household generates 0.87 kg of waste in a day. Organic
waste was the major fraction of waste generated from household.
189
Estimates of overall MSW Generation, Composition, and Characteristics
PlasƟcs
14%
Paper/Paper Products
23%
Glass
6%
Metal
3%
TexƟles
Rubber and Leather
1%
Others
7%
Organic
43%
3.1 Waste Architecture
3.1.1 Household Waste Stream
(a) Generation of Waste
About 97% of respondents gave affirmative answer as kitchen-related activities being
one of the main contributors of waste followed by plastics (87.08%) and paper
(84%). Only 30% of respondent cited animal husbandry as generator of waste in
their household.
(b) Collection of Waste
Upon analysis of the baseline survey, about 21% of household responded to having
their waste collected irregularly by municipality or private sector. 21% respondents
have their waste collected on a weekly basis. Meanwhile, 44% of respondents are
not satisfied with the service provided by municipality or private sector. Majority of
the respondents, i.e. 56% do not segregate waste before collection by municipality,
which adds complexity and risks to the collection process.
(c) Composition of Waste
The baseline survey collected total waste generated for 24 h. From 1280 HHs, which
resulted that on an average, a household generates 0.87 kg of waste in a day. Organic
waste was the major fraction of waste generated from household.