

Solid Waste Management in Small Island …
169
Table 1 Municipal solid wastes composition in Mauritius-Past studies
Year
Area
Percentage composition (%)
Source
Organic Paper Plastic Glass Metal Others
2000
Vieux
Quatre-Bornes
68
12
13
1
1
5
Mohee
(2002)
2004
Not Specified
70
10
9
3
2
6
Ministry of
Environment
[2004 cited
Mohee et al.
(2009)]
2010
Curepipe
48
23
16
2
4
7
UN Habitat
(2010)
2013/2014 Central and
eastern part of
Mauritius
54
14
14
3
3
12
Mohee et al.
(2016)
tons of solid wastes generated, the major constituent is MSW, while the other waste
streams include construction and demolition wastes, industrial wastes, clinical wastes
and e-wastes, amongst others. With a population of 1.22 million in 2017 (Statistics
Mauritius 2017a), the waste generation rate in Mauritius averages 1.11 kg/capita/day
which is below the mean of 1.26 kg/capita/day for SIDS, as reported in Fig. 1.
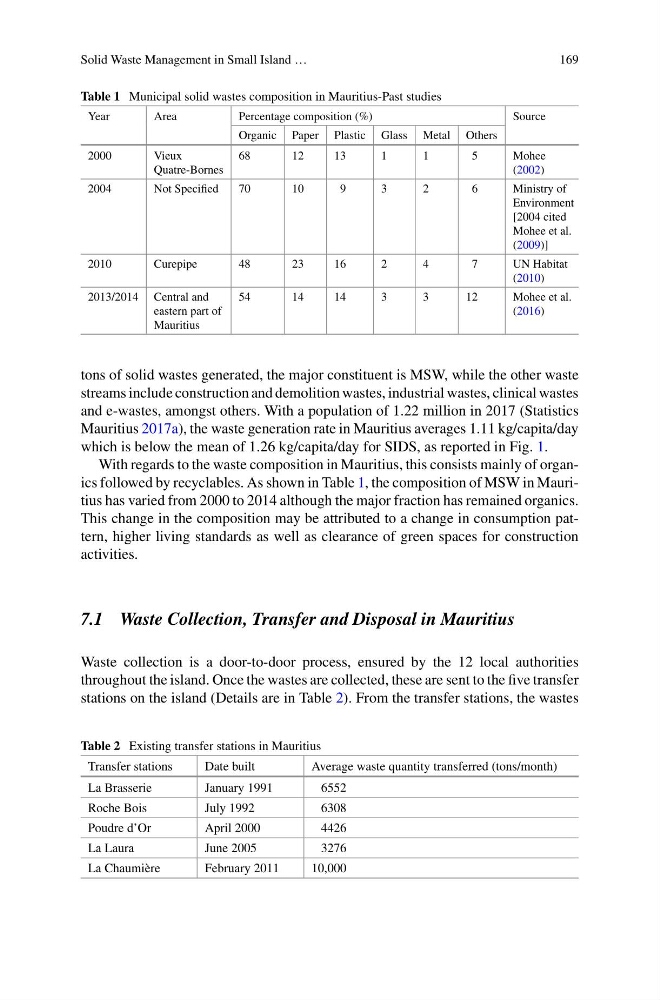
With regards to the waste composition in Mauritius, this consists mainly of organics followed by recyclables. As shown in Table 1, the composition of MSW in Mauritius has varied from 2000 to 2014 although the major fraction has remained organics.
This change in the composition may be attributed to a change in consumption pattern, higher living standards as well as clearance of green spaces for construction
activities.
7.1 Waste Collection, Transfer and Disposal in Mauritius
Waste collection is a door-to-door process, ensured by the 12 local authorities
throughout the island. Once the wastes are collected, these are sent to the five transfer
stations on the island (Details are in Table 2). From the transfer stations, the wastes
Table 2 Existing transfer stations in Mauritius
Transfer stations
Date built
Average waste quantity transferred (tons/month)
La Brasserie
January 1991
6552
Roche Bois
July 1992
6308
Poudre d’Or
April 2000
4426
La Laura
June 2005
3276
La Chaumière
February 2011
10,000
169
Table 1 Municipal solid wastes composition in Mauritius-Past studies
Year
Area
Percentage composition (%)
Source
Organic Paper Plastic Glass Metal Others
2000
Vieux
Quatre-Bornes
68
12
13
1
1
5
Mohee
(2002)
2004
Not Specified
70
10
9
3
2
6
Ministry of
Environment
[2004 cited
Mohee et al.
(2009)]
2010
Curepipe
48
23
16
2
4
7
UN Habitat
(2010)
2013/2014 Central and
eastern part of
Mauritius
54
14
14
3
3
12
Mohee et al.
(2016)
tons of solid wastes generated, the major constituent is MSW, while the other waste
streams include construction and demolition wastes, industrial wastes, clinical wastes
and e-wastes, amongst others. With a population of 1.22 million in 2017 (Statistics
Mauritius 2017a), the waste generation rate in Mauritius averages 1.11 kg/capita/day
which is below the mean of 1.26 kg/capita/day for SIDS, as reported in Fig. 1.
With regards to the waste composition in Mauritius, this consists mainly of organics followed by recyclables. As shown in Table 1, the composition of MSW in Mauritius has varied from 2000 to 2014 although the major fraction has remained organics.
This change in the composition may be attributed to a change in consumption pattern, higher living standards as well as clearance of green spaces for construction
activities.
7.1 Waste Collection, Transfer and Disposal in Mauritius
Waste collection is a door-to-door process, ensured by the 12 local authorities
throughout the island. Once the wastes are collected, these are sent to the five transfer
stations on the island (Details are in Table 2). From the transfer stations, the wastes
Table 2 Existing transfer stations in Mauritius
Transfer stations
Date built
Average waste quantity transferred (tons/month)
La Brasserie
January 1991
6552
Roche Bois
July 1992
6308
Poudre d’Or
April 2000
4426
La Laura
June 2005
3276
La Chaumière
February 2011
10,000