

Environmental Management of Acharya Nagarjuna University …
153
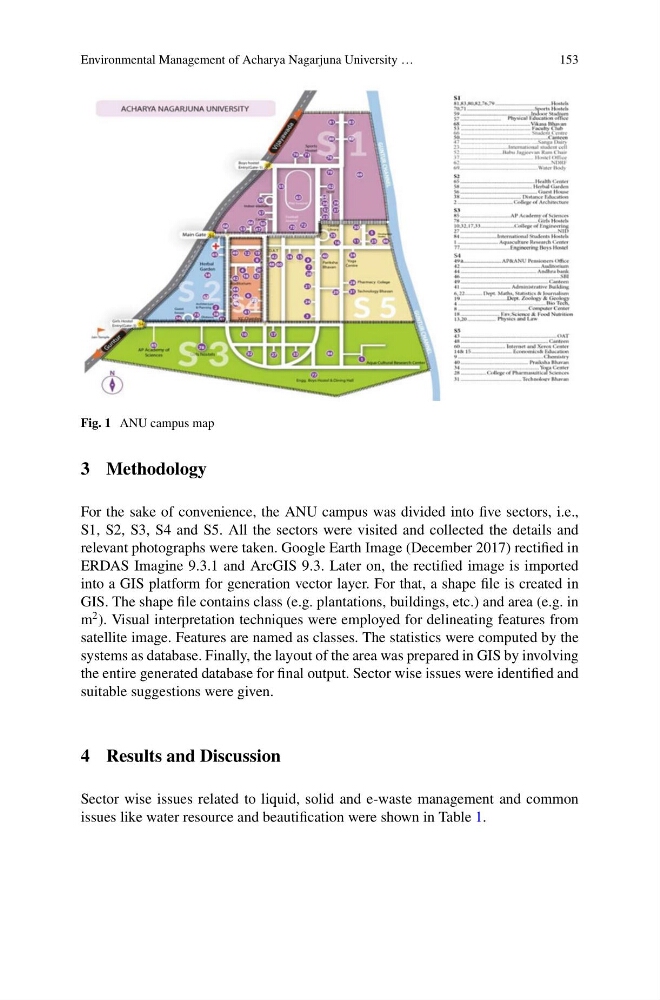
Fig. 1 ANU campus map
3 Methodology
For the sake of convenience, the ANU campus was divided into five sectors, i.e.,
S1, S2, S3, S4 and S5. All the sectors were visited and collected the details and
relevant photographs were taken. Google Earth Image (December 2017) rectified in
ERDAS Imagine 9.3.1 and ArcGIS 9.3. Later on, the rectified image is imported
into a GIS platform for generation vector layer. For that, a shape file is created in
GIS. The shape file contains class (e.g. plantations, buildings, etc.) and area (e.g. in
m
2 ). Visual interpretation techniques were employed for delineating features from
satellite image. Features are named as classes. The statistics were computed by the
systems as database. Finally, the layout of the area was prepared in GIS by involving
the entire generated database for final output. Sector wise issues were identified and
suitable suggestions were given.
4 Results and Discussion
Sector wise issues related to liquid, solid and e-waste management and common
issues like water resource and beautification were shown in Table 1.
153
Fig. 1 ANU campus map
3 Methodology
For the sake of convenience, the ANU campus was divided into five sectors, i.e.,
S1, S2, S3, S4 and S5. All the sectors were visited and collected the details and
relevant photographs were taken. Google Earth Image (December 2017) rectified in
ERDAS Imagine 9.3.1 and ArcGIS 9.3. Later on, the rectified image is imported
into a GIS platform for generation vector layer. For that, a shape file is created in
GIS. The shape file contains class (e.g. plantations, buildings, etc.) and area (e.g. in
m
2 ). Visual interpretation techniques were employed for delineating features from
satellite image. Features are named as classes. The statistics were computed by the
systems as database. Finally, the layout of the area was prepared in GIS by involving
the entire generated database for final output. Sector wise issues were identified and
suitable suggestions were given.
4 Results and Discussion
Sector wise issues related to liquid, solid and e-waste management and common
issues like water resource and beautification were shown in Table 1.