

17 Theoretical Analysis of Phase-Transition Temperature
319
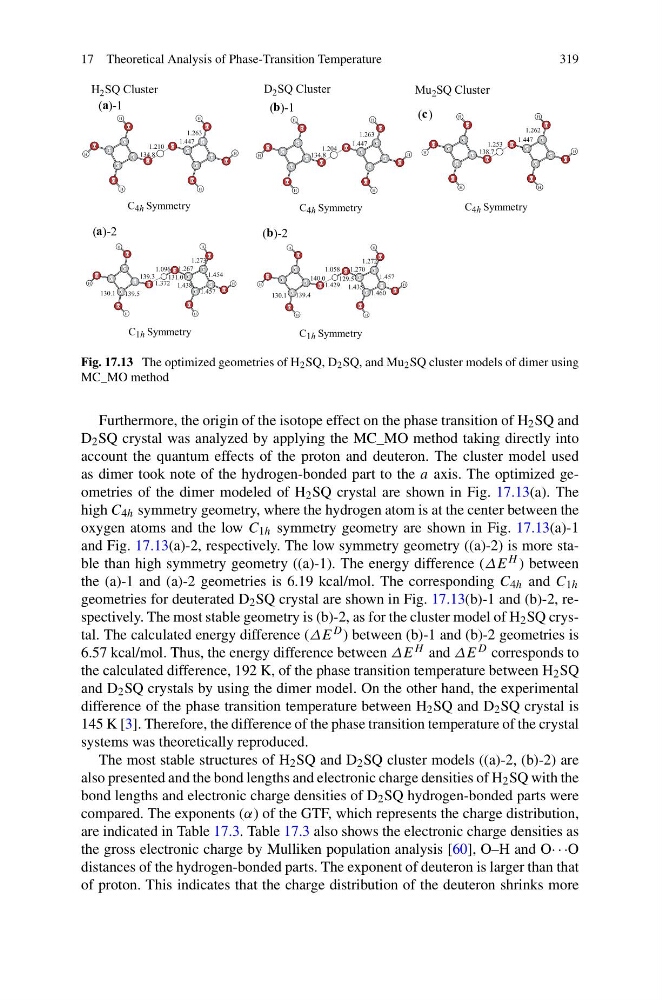
Fig. 17.13 The optimized geometries of H 2 SQ, D 2 SQ, and Mu 2 SQ cluster models of dimer using
MC_MO method
Furthermore, the origin of the isotope effect on the phase transition of H 2 SQ and
D 2 SQ crystal was analyzed by applying the MC_MO method taking directly into
account the quantum effects of the proton and deuteron. The cluster model used
as dimer took note of the hydrogen-bonded part to the a axis. The optimized geometries of the dimer modeled of H 2 SQ crystal are shown in Fig. 17.13(a). The
high C 4h symmetry geometry, where the hydrogen atom is at the center between the
oxygen atoms and the low C 1h symmetry geometry are shown in Fig. 17.13(a)-1
and Fig. 17.13(a)-2, respectively. The low symmetry geometry ((a)-2) is more stable than high symmetry geometry ((a)-1). The energy difference (ΔE H ) between
the (a)-1 and (a)-2 geometries is 6.19 kcal/mol. The corresponding C 4h and C 1h
geometries for deuterated D 2 SQ crystal are shown in Fig. 17.13(b)-1 and (b)-2, respectively. The most stable geometry is (b)-2, as for the cluster model of H 2 SQ crystal. The calculated energy difference (ΔE D ) between (b)-1 and (b)-2 geometries is
6.57 kcal/mol. Thus, the energy difference between ΔE H and ΔE D corresponds to
the calculated difference, 192 K, of the phase transition temperature between H 2 SQ
and D 2 SQ crystals by using the dimer model. On the other hand, the experimental
difference of the phase transition temperature between H 2 SQ and D 2 SQ crystal is
145 K [3]. Therefore, the difference of the phase transition temperature of the crystal
systems was theoretically reproduced.
The most stable structures of H 2 SQ and D 2 SQ cluster models ((a)-2, (b)-2) are
also presented and the bond lengths and electronic charge densities of H 2 SQ with the
bond lengths and electronic charge densities of D 2 SQ hydrogen-bonded parts were
compared. The exponents (α) of the GTF, which represents the charge distribution,
are indicated in Table 17.3. Table 17.3 also shows the electronic charge densities as
the gross electronic charge by Mulliken population analysis [60], O–H and O· · ·O
distances of the hydrogen-bonded parts. The exponent of deuteron is larger than that
of proton. This indicates that the charge distribution of the deuteron shrinks more
319
Fig. 17.13 The optimized geometries of H 2 SQ, D 2 SQ, and Mu 2 SQ cluster models of dimer using
MC_MO method
Furthermore, the origin of the isotope effect on the phase transition of H 2 SQ and
D 2 SQ crystal was analyzed by applying the MC_MO method taking directly into
account the quantum effects of the proton and deuteron. The cluster model used
as dimer took note of the hydrogen-bonded part to the a axis. The optimized geometries of the dimer modeled of H 2 SQ crystal are shown in Fig. 17.13(a). The
high C 4h symmetry geometry, where the hydrogen atom is at the center between the
oxygen atoms and the low C 1h symmetry geometry are shown in Fig. 17.13(a)-1
and Fig. 17.13(a)-2, respectively. The low symmetry geometry ((a)-2) is more stable than high symmetry geometry ((a)-1). The energy difference (ΔE H ) between
the (a)-1 and (a)-2 geometries is 6.19 kcal/mol. The corresponding C 4h and C 1h
geometries for deuterated D 2 SQ crystal are shown in Fig. 17.13(b)-1 and (b)-2, respectively. The most stable geometry is (b)-2, as for the cluster model of H 2 SQ crystal. The calculated energy difference (ΔE D ) between (b)-1 and (b)-2 geometries is
6.57 kcal/mol. Thus, the energy difference between ΔE H and ΔE D corresponds to
the calculated difference, 192 K, of the phase transition temperature between H 2 SQ
and D 2 SQ crystals by using the dimer model. On the other hand, the experimental
difference of the phase transition temperature between H 2 SQ and D 2 SQ crystal is
145 K [3]. Therefore, the difference of the phase transition temperature of the crystal
systems was theoretically reproduced.
The most stable structures of H 2 SQ and D 2 SQ cluster models ((a)-2, (b)-2) are
also presented and the bond lengths and electronic charge densities of H 2 SQ with the
bond lengths and electronic charge densities of D 2 SQ hydrogen-bonded parts were
compared. The exponents (α) of the GTF, which represents the charge distribution,
are indicated in Table 17.3. Table 17.3 also shows the electronic charge densities as
the gross electronic charge by Mulliken population analysis [60], O–H and O· · ·O
distances of the hydrogen-bonded parts. The exponent of deuteron is larger than that
of proton. This indicates that the charge distribution of the deuteron shrinks more