

7 Spin Torque and Zeta Force in Allene-Type Molecules
137
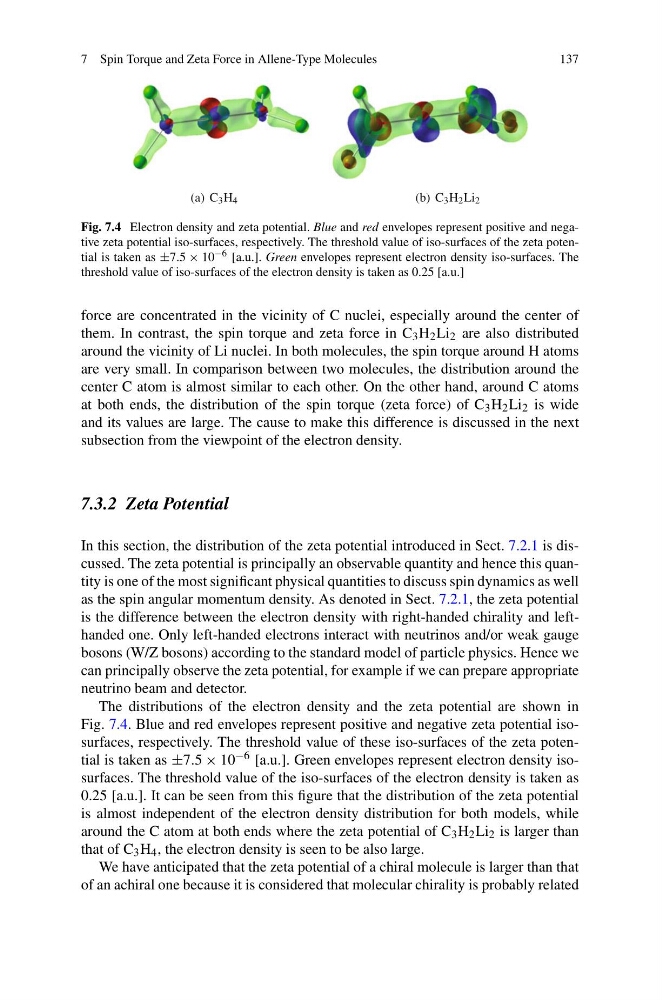
Fig. 7.4 Electron density and zeta potential. Blue and red envelopes represent positive and negative zeta potential iso-surfaces, respectively. The threshold value of iso-surfaces of the zeta potential is taken as ±7.5 × 10 −6 [a.u.]. Green envelopes represent electron density iso-surfaces. The
threshold value of iso-surfaces of the electron density is taken as 0.25 [a.u.]
force are concentrated in the vicinity of C nuclei, especially around the center of
them. In contrast, the spin torque and zeta force in C 3 H 2 Li 2 are also distributed
around the vicinity of Li nuclei. In both molecules, the spin torque around H atoms
are very small. In comparison between two molecules, the distribution around the
center C atom is almost similar to each other. On the other hand, around C atoms
at both ends, the distribution of the spin torque (zeta force) of C 3 H 2 Li 2 is wide
and its values are large. The cause to make this difference is discussed in the next
subsection from the viewpoint of the electron density.
7.3.2 Zeta Potential
In this section, the distribution of the zeta potential introduced in Sect. 7.2.1 is discussed. The zeta potential is principally an observable quantity and hence this quantity is one of the most significant physical quantities to discuss spin dynamics as well
as the spin angular momentum density. As denoted in Sect. 7.2.1, the zeta potential
is the difference between the electron density with right-handed chirality and lefthanded one. Only left-handed electrons interact with neutrinos and/or weak gauge
bosons (W/Z bosons) according to the standard model of particle physics. Hence we
can principally observe the zeta potential, for example if we can prepare appropriate
neutrino beam and detector.
The distributions of the electron density and the zeta potential are shown in
Fig. 7.4. Blue and red envelopes represent positive and negative zeta potential isosurfaces, respectively. The threshold value of these iso-surfaces of the zeta potential is taken as ±7.5 × 10 −6 [a.u.]. Green envelopes represent electron density isosurfaces. The threshold value of the iso-surfaces of the electron density is taken as
0.25 [a.u.]. It can be seen from this figure that the distribution of the zeta potential
is almost independent of the electron density distribution for both models, while
around the C atom at both ends where the zeta potential of C 3 H 2 Li 2 is larger than
that of C 3 H 4 , the electron density is seen to be also large.
We have anticipated that the zeta potential of a chiral molecule is larger than that
of an achiral one because it is considered that molecular chirality is probably related
137
Fig. 7.4 Electron density and zeta potential. Blue and red envelopes represent positive and negative zeta potential iso-surfaces, respectively. The threshold value of iso-surfaces of the zeta potential is taken as ±7.5 × 10 −6 [a.u.]. Green envelopes represent electron density iso-surfaces. The
threshold value of iso-surfaces of the electron density is taken as 0.25 [a.u.]
force are concentrated in the vicinity of C nuclei, especially around the center of
them. In contrast, the spin torque and zeta force in C 3 H 2 Li 2 are also distributed
around the vicinity of Li nuclei. In both molecules, the spin torque around H atoms
are very small. In comparison between two molecules, the distribution around the
center C atom is almost similar to each other. On the other hand, around C atoms
at both ends, the distribution of the spin torque (zeta force) of C 3 H 2 Li 2 is wide
and its values are large. The cause to make this difference is discussed in the next
subsection from the viewpoint of the electron density.
7.3.2 Zeta Potential
In this section, the distribution of the zeta potential introduced in Sect. 7.2.1 is discussed. The zeta potential is principally an observable quantity and hence this quantity is one of the most significant physical quantities to discuss spin dynamics as well
as the spin angular momentum density. As denoted in Sect. 7.2.1, the zeta potential
is the difference between the electron density with right-handed chirality and lefthanded one. Only left-handed electrons interact with neutrinos and/or weak gauge
bosons (W/Z bosons) according to the standard model of particle physics. Hence we
can principally observe the zeta potential, for example if we can prepare appropriate
neutrino beam and detector.
The distributions of the electron density and the zeta potential are shown in
Fig. 7.4. Blue and red envelopes represent positive and negative zeta potential isosurfaces, respectively. The threshold value of these iso-surfaces of the zeta potential is taken as ±7.5 × 10 −6 [a.u.]. Green envelopes represent electron density isosurfaces. The threshold value of the iso-surfaces of the electron density is taken as
0.25 [a.u.]. It can be seen from this figure that the distribution of the zeta potential
is almost independent of the electron density distribution for both models, while
around the C atom at both ends where the zeta potential of C 3 H 2 Li 2 is larger than
that of C 3 H 4 , the electron density is seen to be also large.
We have anticipated that the zeta potential of a chiral molecule is larger than that
of an achiral one because it is considered that molecular chirality is probably related