

How Molecular Modelling Tools Can Help …
207
models of activated carbons and mesoporous structures, without and with aminosilane functionalities post-grafted on the silanol groups, can be found in previous works
[180, 182, 188, 189].
Molecular simulations were performed using the GCMC technique. This method
allows exchanging atoms or molecules with a reservoir at a constant temperature,
volume and chemical potential, thus mimicking the experimental adsorption conditions. The amount of adsorbed molecules is calculated using a statistically averaged approach after the equilibrium stage for every single pressure point, allowing
the construction of adsorption isotherms [15]. At each pressure (chemical potential) condition, at least 1.0 × 10
6 MC moves were performed for data collection
after equilibration. The total energy of the system was calculated as the sum of
the adsorbate-adsorbent and the adsorbate–adsorbate interaction energies, modelled
as a combination of LJ (12–6) and Coulomb potentials. Force fields used for each
structure can be found in our previous works [15, 180–182, 189–192]. CO 2 and
N 2 molecules were modelled using the TraPPE force field [193], while the TIP4P/2005 model [194] was used to represent H 2 O molecules in order to evaluate
moisture effects in the mixture. A cut-off radius of 12.5 Å was applied to the LJ
interactions, while the long-range electrostatic interactions were calculated by using
the Ewald summation, and Lorentz–Berthelot combining rules were used to calculate
the adsorbate/framework and the LJ crossed parameters.
Simulated adsorption isotherms were appropriately validated against experimental data (when available) to establish the accuracy of the model for pure components calculated in this work, as well as the quality of the multi-component mixtures
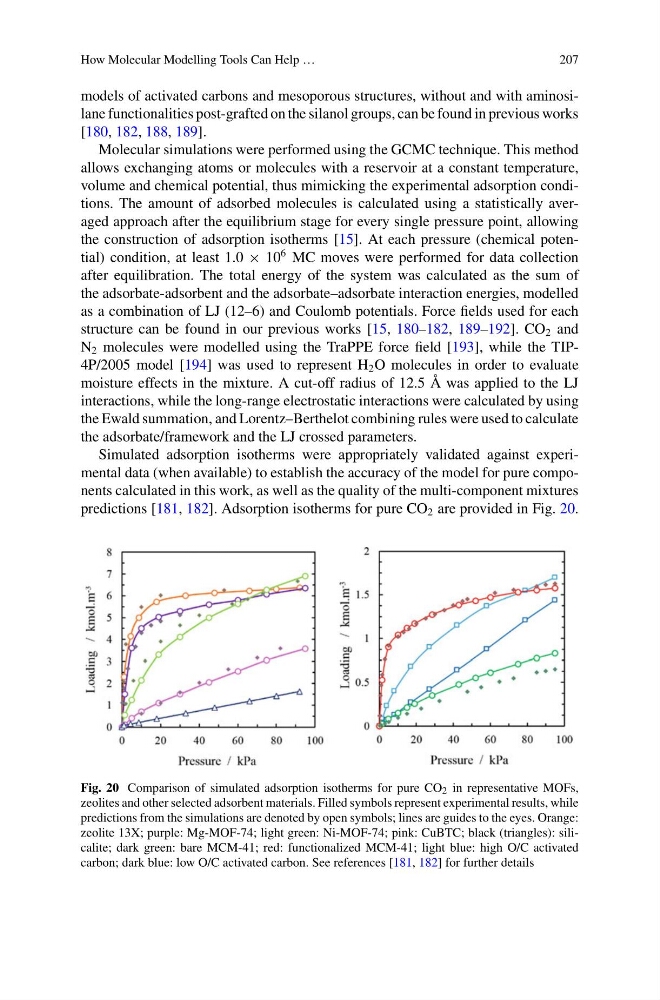
predictions [181, 182]. Adsorption isotherms for pure CO 2 are provided in Fig. 20.
Fig. 20 Comparison of simulated adsorption isotherms for pure CO 2 in representative MOFs,
zeolites and other selected adsorbent materials. Filled symbols represent experimental results, while
predictions from the simulations are denoted by open symbols; lines are guides to the eyes. Orange:
zeolite 13X; purple: Mg-MOF-74; light green: Ni-MOF-74; pink: CuBTC; black (triangles): silicalite; dark green: bare MCM-41; red: functionalized MCM-41; light blue: high O/C activated
carbon; dark blue: low O/C activated carbon. See references [181, 182] for further details
207
models of activated carbons and mesoporous structures, without and with aminosilane functionalities post-grafted on the silanol groups, can be found in previous works
[180, 182, 188, 189].
Molecular simulations were performed using the GCMC technique. This method
allows exchanging atoms or molecules with a reservoir at a constant temperature,
volume and chemical potential, thus mimicking the experimental adsorption conditions. The amount of adsorbed molecules is calculated using a statistically averaged approach after the equilibrium stage for every single pressure point, allowing
the construction of adsorption isotherms [15]. At each pressure (chemical potential) condition, at least 1.0 × 10
6 MC moves were performed for data collection
after equilibration. The total energy of the system was calculated as the sum of
the adsorbate-adsorbent and the adsorbate–adsorbate interaction energies, modelled
as a combination of LJ (12–6) and Coulomb potentials. Force fields used for each
structure can be found in our previous works [15, 180–182, 189–192]. CO 2 and
N 2 molecules were modelled using the TraPPE force field [193], while the TIP4P/2005 model [194] was used to represent H 2 O molecules in order to evaluate
moisture effects in the mixture. A cut-off radius of 12.5 Å was applied to the LJ
interactions, while the long-range electrostatic interactions were calculated by using
the Ewald summation, and Lorentz–Berthelot combining rules were used to calculate
the adsorbate/framework and the LJ crossed parameters.
Simulated adsorption isotherms were appropriately validated against experimental data (when available) to establish the accuracy of the model for pure components calculated in this work, as well as the quality of the multi-component mixtures
predictions [181, 182]. Adsorption isotherms for pure CO 2 are provided in Fig. 20.
Fig. 20 Comparison of simulated adsorption isotherms for pure CO 2 in representative MOFs,
zeolites and other selected adsorbent materials. Filled symbols represent experimental results, while
predictions from the simulations are denoted by open symbols; lines are guides to the eyes. Orange:
zeolite 13X; purple: Mg-MOF-74; light green: Ni-MOF-74; pink: CuBTC; black (triangles): silicalite; dark green: bare MCM-41; red: functionalized MCM-41; light blue: high O/C activated
carbon; dark blue: low O/C activated carbon. See references [181, 182] for further details