

50
Y. Qin et al.
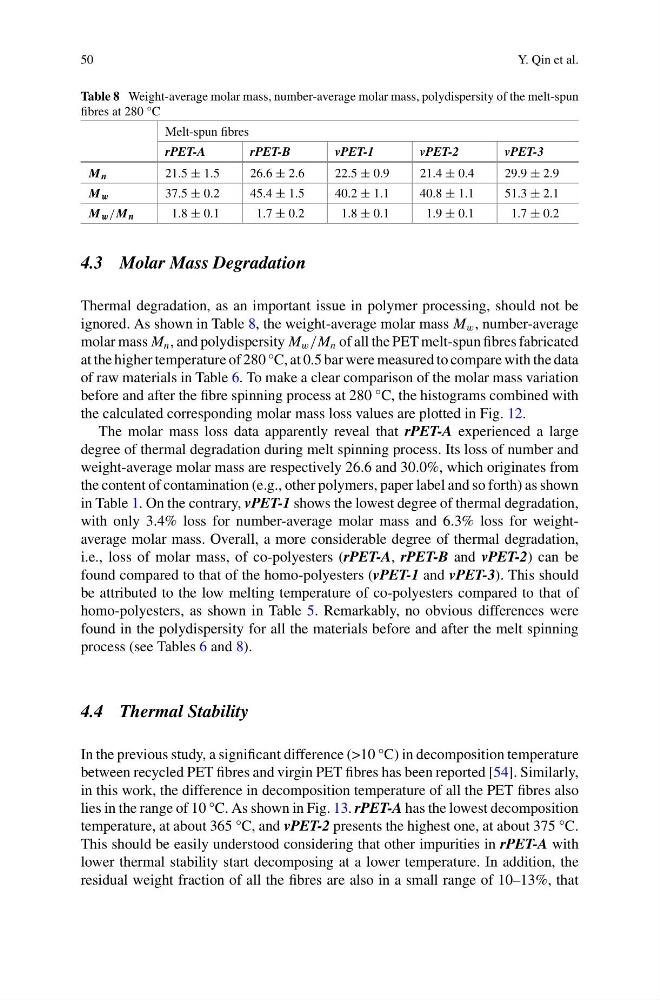
Table 8 Weight-average molar mass, number-average molar mass, polydispersity of the melt-spun
fibres at 280 °C
Melt-spun fibres
rPET-A
rPET-B
vPET-1
vPET-2
vPET-3
M n
21.5 ± 1.5
26.6 ± 2.6
22.5 ± 0.9
21.4 ± 0.4
29.9 ± 2.9
M w
37.5 ± 0.2
45.4 ± 1.5
40.2 ± 1.1
40.8 ± 1.1
51.3 ± 2.1
M w /M n
1.8 ± 0.1
1.7 ± 0.2
1.8 ± 0.1
1.9 ± 0.1
1.7 ± 0.2
4.3 Molar Mass Degradation
Thermal degradation, as an important issue in polymer processing, should not be
ignored. As shown in Table 8, the weight-average molar mass M w , number-average
molar mass M n , and polydispersity M w /M n of all the PET melt-spun fibres fabricated
at the higher temperature of 280 °C, at 0.5 bar were measured to compare with the data
of raw materials in Table 6. To make a clear comparison of the molar mass variation
before and after the fibre spinning process at 280 °C, the histograms combined with
the calculated corresponding molar mass loss values are plotted in Fig. 12.
The molar mass loss data apparently reveal that rPET-A experienced a large
degree of thermal degradation during melt spinning process. Its loss of number and
weight-average molar mass are respectively 26.6 and 30.0%, which originates from
the content of contamination (e.g., other polymers, paper label and so forth) as shown
in Table 1. On the contrary, vPET-1 shows the lowest degree of thermal degradation,
with only 3.4% loss for number-average molar mass and 6.3% loss for weightaverage molar mass. Overall, a more considerable degree of thermal degradation,
i.e., loss of molar mass, of co-polyesters (rPET-A, rPET-B and vPET-2) can be
found compared to that of the homo-polyesters (vPET-1 and vPET-3). This should
be attributed to the low melting temperature of co-polyesters compared to that of
homo-polyesters, as shown in Table 5. Remarkably, no obvious differences were
found in the polydispersity for all the materials before and after the melt spinning
process (see Tables 6 and 8).
4.4 Thermal Stability
In the previous study, a significant difference (>10 °C) in decomposition temperature
between recycled PET fibres and virgin PET fibres has been reported [54]. Similarly,
in this work, the difference in decomposition temperature of all the PET fibres also
lies in the range of 10 °C. As shown in Fig. 13. rPET-A has the lowest decomposition
temperature, at about 365 °C, and vPET-2 presents the highest one, at about 375 °C.
This should be easily understood considering that other impurities in rPET-A with
lower thermal stability start decomposing at a lower temperature. In addition, the
residual weight fraction of all the fibres are also in a small range of 10–13%, that
Y. Qin et al.
Table 8 Weight-average molar mass, number-average molar mass, polydispersity of the melt-spun
fibres at 280 °C
Melt-spun fibres
rPET-A
rPET-B
vPET-1
vPET-2
vPET-3
M n
21.5 ± 1.5
26.6 ± 2.6
22.5 ± 0.9
21.4 ± 0.4
29.9 ± 2.9
M w
37.5 ± 0.2
45.4 ± 1.5
40.2 ± 1.1
40.8 ± 1.1
51.3 ± 2.1
M w /M n
1.8 ± 0.1
1.7 ± 0.2
1.8 ± 0.1
1.9 ± 0.1
1.7 ± 0.2
4.3 Molar Mass Degradation
Thermal degradation, as an important issue in polymer processing, should not be
ignored. As shown in Table 8, the weight-average molar mass M w , number-average
molar mass M n , and polydispersity M w /M n of all the PET melt-spun fibres fabricated
at the higher temperature of 280 °C, at 0.5 bar were measured to compare with the data
of raw materials in Table 6. To make a clear comparison of the molar mass variation
before and after the fibre spinning process at 280 °C, the histograms combined with
the calculated corresponding molar mass loss values are plotted in Fig. 12.
The molar mass loss data apparently reveal that rPET-A experienced a large
degree of thermal degradation during melt spinning process. Its loss of number and
weight-average molar mass are respectively 26.6 and 30.0%, which originates from
the content of contamination (e.g., other polymers, paper label and so forth) as shown
in Table 1. On the contrary, vPET-1 shows the lowest degree of thermal degradation,
with only 3.4% loss for number-average molar mass and 6.3% loss for weightaverage molar mass. Overall, a more considerable degree of thermal degradation,
i.e., loss of molar mass, of co-polyesters (rPET-A, rPET-B and vPET-2) can be
found compared to that of the homo-polyesters (vPET-1 and vPET-3). This should
be attributed to the low melting temperature of co-polyesters compared to that of
homo-polyesters, as shown in Table 5. Remarkably, no obvious differences were
found in the polydispersity for all the materials before and after the melt spinning
process (see Tables 6 and 8).
4.4 Thermal Stability
In the previous study, a significant difference (>10 °C) in decomposition temperature
between recycled PET fibres and virgin PET fibres has been reported [54]. Similarly,
in this work, the difference in decomposition temperature of all the PET fibres also
lies in the range of 10 °C. As shown in Fig. 13. rPET-A has the lowest decomposition
temperature, at about 365 °C, and vPET-2 presents the highest one, at about 375 °C.
This should be easily understood considering that other impurities in rPET-A with
lower thermal stability start decomposing at a lower temperature. In addition, the
residual weight fraction of all the fibres are also in a small range of 10–13%, that