

tamoxifen addition, allowing a tight time control (Fig. 4a–d). Lossof-function conditions can be obtained by the use of UAS-driven
dominant negative proteins. This setup allows the overexpression
of protein in the entire NC population. Moreover, clonal induction
in a restricted number of NC cells is also possible. To do this,
one-cell stage Sox10:Kalt4ER
kg328Tg embryos are injected with
plasmid DNA of any UAS-driven construct of interest (Fig. 4e–
h). Plasmid DNA is unevenly distributed in the early embryo,
leading to a small number of random cells inheriting it. Only cells
fated to the NC lineage that have inherited the plasmid will express
the protein of interest upon tamoxifen addition, allowing for
mosaic expression. Hence, the Sox10:Kalt4ER
kg328Tg transgenic
is a versatile tool that will allow the fine molecular dissection of
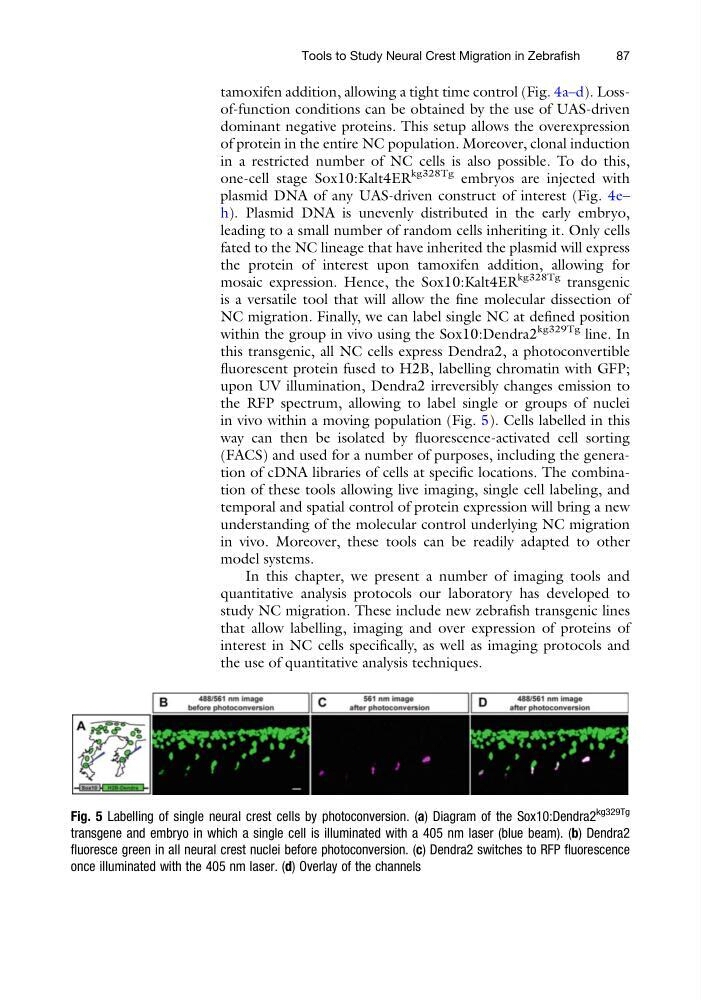
NC migration. Finally, we can label single NC at defined position
within the group in vivo using the Sox10:Dendra2
kg329Tg line. In
this transgenic, all NC cells express Dendra2, a photoconvertible
fluorescent protein fused to H2B, labelling chromatin with GFP;
upon UV illumination, Dendra2 irreversibly changes emission to
the RFP spectrum, allowing to label single or groups of nuclei
in vivo within a moving population (Fig. 5). Cells labelled in this
way can then be isolated by fluorescence-activated cell sorting
(FACS) and used for a number of purposes, including the generation of cDNA libraries of cells at specific locations. The combination of these tools allowing live imaging, single cell labeling, and
temporal and spatial control of protein expression will bring a new
understanding of the molecular control underlying NC migration
in vivo. Moreover, these tools can be readily adapted to other
model systems.
In this chapter, we present a number of imaging tools and
quantitative analysis protocols our laboratory has developed to
study NC migration. These include new zebrafish transgenic lines
that allow labelling, imaging and over expression of proteins of
interest in NC cells specifically, as well as imaging protocols and
the use of quantitative analysis techniques.
Fig. 5 Labelling of single neural crest cells by photoconversion. (a) Diagram of the Sox10:Dendra2
kg329Tg
transgene and embryo in which a single cell is illuminated with a 405 nm laser (blue beam). (b) Dendra2
fluoresce green in all neural crest nuclei before photoconversion. (c) Dendra2 switches to RFP fluorescence
once illuminated with the 405 nm laser. (d) Overlay of the channels
Tools to Study Neural Crest Migration in Zebrafish
87
dominant negative proteins. This setup allows the overexpression
of protein in the entire NC population. Moreover, clonal induction
in a restricted number of NC cells is also possible. To do this,
one-cell stage Sox10:Kalt4ER
kg328Tg embryos are injected with
plasmid DNA of any UAS-driven construct of interest (Fig. 4e–
h). Plasmid DNA is unevenly distributed in the early embryo,
leading to a small number of random cells inheriting it. Only cells
fated to the NC lineage that have inherited the plasmid will express
the protein of interest upon tamoxifen addition, allowing for
mosaic expression. Hence, the Sox10:Kalt4ER
kg328Tg transgenic
is a versatile tool that will allow the fine molecular dissection of
NC migration. Finally, we can label single NC at defined position
within the group in vivo using the Sox10:Dendra2
kg329Tg line. In
this transgenic, all NC cells express Dendra2, a photoconvertible
fluorescent protein fused to H2B, labelling chromatin with GFP;
upon UV illumination, Dendra2 irreversibly changes emission to
the RFP spectrum, allowing to label single or groups of nuclei
in vivo within a moving population (Fig. 5). Cells labelled in this
way can then be isolated by fluorescence-activated cell sorting
(FACS) and used for a number of purposes, including the generation of cDNA libraries of cells at specific locations. The combination of these tools allowing live imaging, single cell labeling, and
temporal and spatial control of protein expression will bring a new
understanding of the molecular control underlying NC migration
in vivo. Moreover, these tools can be readily adapted to other
model systems.
In this chapter, we present a number of imaging tools and
quantitative analysis protocols our laboratory has developed to
study NC migration. These include new zebrafish transgenic lines
that allow labelling, imaging and over expression of proteins of
interest in NC cells specifically, as well as imaging protocols and
the use of quantitative analysis techniques.
Fig. 5 Labelling of single neural crest cells by photoconversion. (a) Diagram of the Sox10:Dendra2
kg329Tg
transgene and embryo in which a single cell is illuminated with a 405 nm laser (blue beam). (b) Dendra2
fluoresce green in all neural crest nuclei before photoconversion. (c) Dendra2 switches to RFP fluorescence
once illuminated with the 405 nm laser. (d) Overlay of the channels
Tools to Study Neural Crest Migration in Zebrafish
87