

(H2B-monomeric Cherry) and plasma membrane with green fluorescence (GPI-GFP). This combination allows to concomitantly
follow both the morphology and movement of individual cells. It
has the additional advantage of retaining nuclear labelling upon
nuclear membrane breakage, permitting the study of mitotic events
in detail (Fig. 2) and the tracing of cell lineage unambiguously
(Fig. 3). We regularly image these embryos overnight (16–20 h)
and have recorded movies lasting several days. These generate large
amounts of data which commercial analysis packages handle with
difficulty. To solve this problem, we have assembled a pipeline of
tools that can handle large data files. The first step, often disregarded, is to stabilize the images by correcting all movement that
does not correspond to cell migration (e.g., drift, rotation, deformation, or growth; Supplementary Movie 1). This is best performed by obtaining a correction matrix using anatomical
landmarks on bright field images. This correction matrix is then
applied to the fluorescent images, and nuclear tracking is performed in three dimensions (3D). It is important to track cells in
3D, as it permits the separation of nuclei in densely packed groups
(e.g., CNC streams; Fig. 3a–c), or of cells that describe parallel
trajectories in different z planes (e.g., TNC chains on each side of
the embryo; Fig. 3d, e). Most importantly, it allows to accurately
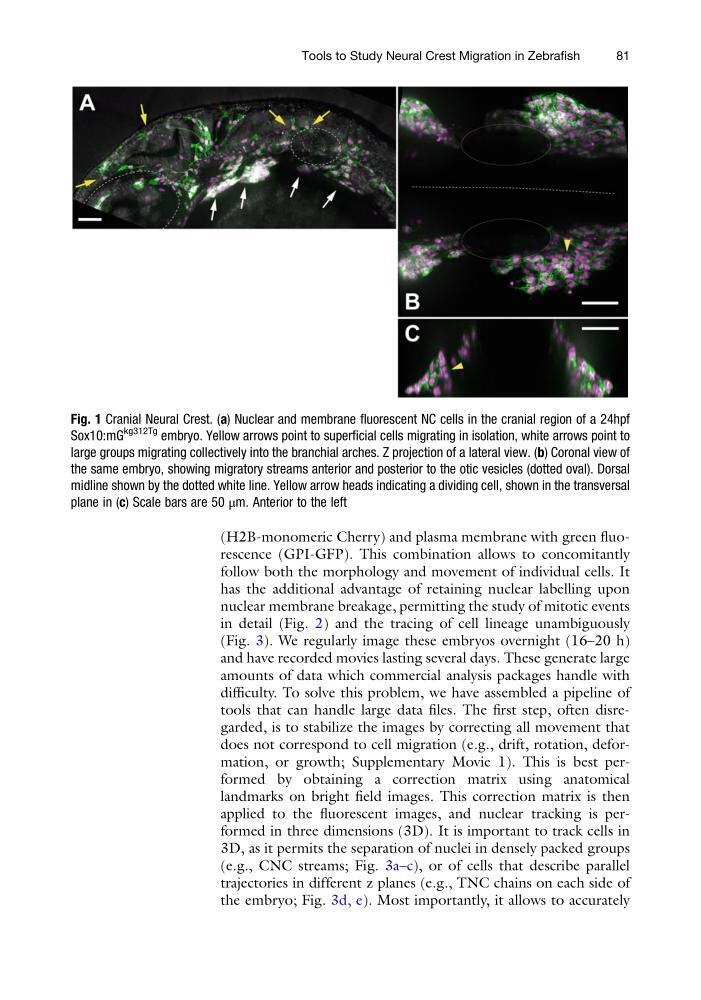
Fig. 1 Cranial Neural Crest. (a) Nuclear and membrane fluorescent NC cells in the cranial region of a 24hpf
Sox10:mG
kg312Tg embryo. Yellow arrows point to superficial cells migrating in isolation, white arrows point to
large groups migrating collectively into the branchial arches. Z projection of a lateral view. (b) Coronal view of
the same embryo, showing migratory streams anterior and posterior to the otic vesicles (dotted oval). Dorsal
midline shown by the dotted white line. Yellow arrow heads indicating a dividing cell, shown in the transversal
plane in (c) Scale bars are 50 μm. Anterior to the left
Tools to Study Neural Crest Migration in Zebrafish
81
follow both the morphology and movement of individual cells. It
has the additional advantage of retaining nuclear labelling upon
nuclear membrane breakage, permitting the study of mitotic events
in detail (Fig. 2) and the tracing of cell lineage unambiguously
(Fig. 3). We regularly image these embryos overnight (16–20 h)
and have recorded movies lasting several days. These generate large
amounts of data which commercial analysis packages handle with
difficulty. To solve this problem, we have assembled a pipeline of
tools that can handle large data files. The first step, often disregarded, is to stabilize the images by correcting all movement that
does not correspond to cell migration (e.g., drift, rotation, deformation, or growth; Supplementary Movie 1). This is best performed by obtaining a correction matrix using anatomical
landmarks on bright field images. This correction matrix is then
applied to the fluorescent images, and nuclear tracking is performed in three dimensions (3D). It is important to track cells in
3D, as it permits the separation of nuclei in densely packed groups
(e.g., CNC streams; Fig. 3a–c), or of cells that describe parallel
trajectories in different z planes (e.g., TNC chains on each side of
the embryo; Fig. 3d, e). Most importantly, it allows to accurately
Fig. 1 Cranial Neural Crest. (a) Nuclear and membrane fluorescent NC cells in the cranial region of a 24hpf
Sox10:mG
kg312Tg embryo. Yellow arrows point to superficial cells migrating in isolation, white arrows point to
large groups migrating collectively into the branchial arches. Z projection of a lateral view. (b) Coronal view of
the same embryo, showing migratory streams anterior and posterior to the otic vesicles (dotted oval). Dorsal
midline shown by the dotted white line. Yellow arrow heads indicating a dividing cell, shown in the transversal
plane in (c) Scale bars are 50 μm. Anterior to the left
Tools to Study Neural Crest Migration in Zebrafish
81