

the maximum production rate, G, will be obtained when the activator is highly expressed. Thus, the basal production rate of the
gene must be g ¼
G
λ , λ > 1. For a gene with only one inhibitor, the
maximum production rate will be obtained in the absence of inhibitor expression. Thus, G ¼ g where g is the basal production rate.
This approach can easily be generalized to the case when a gene has
multiple activators and inhibitors [60]. RACIPE randomizes the
maximum production rate (G) and then calculates g using the
above-mentioned approach.
The second assumption is that in order for the ensemble of
models to be representative of most biological possibilities, each
regulatory link in the circuit must have an almost equal chance of
being functional and being nonfunctional. To ensure this, RACIPE
chooses the threshold parameters in such a manner that the steady
state concentration of the corresponding regulator in different
models within the ensemble is roughly equally likely to be above
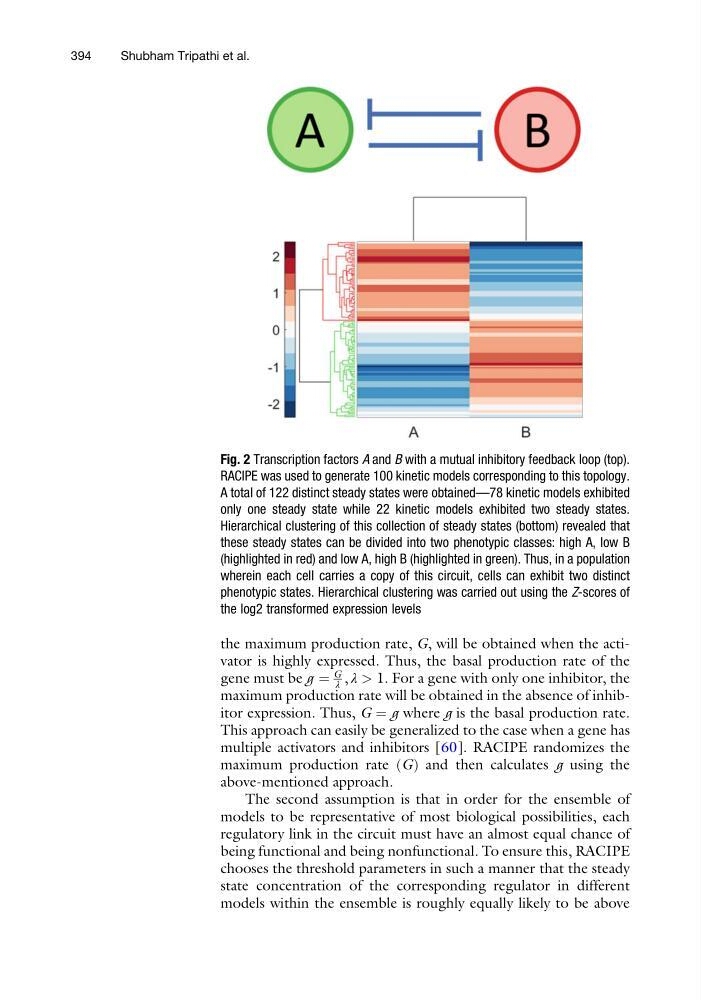
Fig. 2 Transcription factors A and B with a mutual inhibitory feedback loop (top).
RACIPE was used to generate 100 kinetic models corresponding to this topology.
A total of 122 distinct steady states were obtained—78 kinetic models exhibited
only one steady state while 22 kinetic models exhibited two steady states.
Hierarchical clustering of this collection of steady states (bottom) revealed that
these steady states can be divided into two phenotypic classes: high A, low B
(highlighted in red) and low A, high B (highlighted in green). Thus, in a population
wherein each cell carries a copy of this circuit, cells can exhibit two distinct
phenotypic states. Hierarchical clustering was carried out using the Z-scores of
the log2 transformed expression levels
394
Shubham Tripathi et al.
gene must be g ¼
G
λ , λ > 1. For a gene with only one inhibitor, the
maximum production rate will be obtained in the absence of inhibitor expression. Thus, G ¼ g where g is the basal production rate.
This approach can easily be generalized to the case when a gene has
multiple activators and inhibitors [60]. RACIPE randomizes the
maximum production rate (G) and then calculates g using the
above-mentioned approach.
The second assumption is that in order for the ensemble of
models to be representative of most biological possibilities, each
regulatory link in the circuit must have an almost equal chance of
being functional and being nonfunctional. To ensure this, RACIPE
chooses the threshold parameters in such a manner that the steady
state concentration of the corresponding regulator in different
models within the ensemble is roughly equally likely to be above
Fig. 2 Transcription factors A and B with a mutual inhibitory feedback loop (top).
RACIPE was used to generate 100 kinetic models corresponding to this topology.
A total of 122 distinct steady states were obtained—78 kinetic models exhibited
only one steady state while 22 kinetic models exhibited two steady states.
Hierarchical clustering of this collection of steady states (bottom) revealed that
these steady states can be divided into two phenotypic classes: high A, low B
(highlighted in red) and low A, high B (highlighted in green). Thus, in a population
wherein each cell carries a copy of this circuit, cells can exhibit two distinct
phenotypic states. Hierarchical clustering was carried out using the Z-scores of
the log2 transformed expression levels
394
Shubham Tripathi et al.