

14. Seal the plate with an adhesive film, using a clean instrument
and insisting onto the borders. Only then, take out the protective film. At this stage, it is possible to keep the plate overnight
at 4
C and protected from light.
15. Centrifuge 30 s at 100 Â g.
16. Enter parameters on the 384-well PCR machine. We use the
following cycle:
95
C for 1 min.
95
C for 15 s.
60
C for 30 s—Go to previous step and repeat cycle 40 times.
Immediately followed by the melting curve parameters:
95
C for 15 s.
60
C for 15 s.
95
C for 15 s.
17. Run the qPCR program.
Analyze data following steps 18–23.
18. Calculate the standard deviation of the triplicates. It should be
inferior to 0.1. If not, remove the aberrant value (see Note 49).
19. Our primers having an efficiency close to 100% (primer efficiency being below 100% is not a problem as far as all primer
used have the same efficiency), and considering that the efficiency of both the target and the reference gene are equal to
2 (the amount of the PCR product is doubling at every cycle),
we normalize the expression ratio using the “Delta-Delta-C t ”
method (or Livak method):
ΔΔCt ¼ 2
À CtÁ GOI,T
ð
Þ À Ct RG,T
ð
Þ
ð
Þ À Ct GOI,NT
ð
Þ À Ct RG,NT
ð
Þ
ð
Þ
ð
Þ
ð1Þ
with:
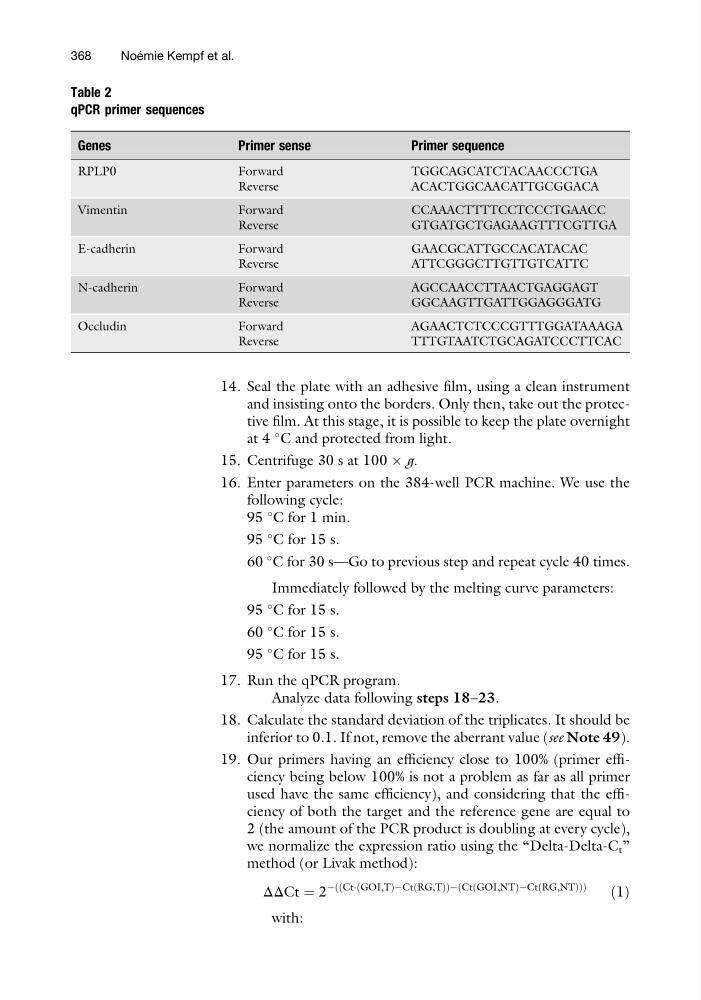
Table 2
qPCR primer sequences
Genes
Primer sense
Primer sequence
RPLP0
Forward
TGGCAGCATCTACAACCCTGA
Reverse
ACACTGGCAACATTGCGGACA
Vimentin
Forward
CCAAACTTTTCCTCCCTGAACC
Reverse
GTGATGCTGAGAAGTTTCGTTGA
E-cadherin
Forward
GAACGCATTGCCACATACAC
Reverse
ATTCGGGCTTGTTGTCATTC
N-cadherin
Forward
AGCCAACCTTAACTGAGGAGT
Reverse
GGCAAGTTGATTGGAGGGATG
Occludin
Forward
AGAACTCTCCCGTTTGGATAAAGA
Reverse
TTTGTAATCTGCAGATCCCTTCAC
368
Noe ´ mie Kempf et al.
and insisting onto the borders. Only then, take out the protective film. At this stage, it is possible to keep the plate overnight
at 4
C and protected from light.
15. Centrifuge 30 s at 100 Â g.
16. Enter parameters on the 384-well PCR machine. We use the
following cycle:
95
C for 1 min.
95
C for 15 s.
60
C for 30 s—Go to previous step and repeat cycle 40 times.
Immediately followed by the melting curve parameters:
95
C for 15 s.
60
C for 15 s.
95
C for 15 s.
17. Run the qPCR program.
Analyze data following steps 18–23.
18. Calculate the standard deviation of the triplicates. It should be
inferior to 0.1. If not, remove the aberrant value (see Note 49).
19. Our primers having an efficiency close to 100% (primer efficiency being below 100% is not a problem as far as all primer
used have the same efficiency), and considering that the efficiency of both the target and the reference gene are equal to
2 (the amount of the PCR product is doubling at every cycle),
we normalize the expression ratio using the “Delta-Delta-C t ”
method (or Livak method):
ΔΔCt ¼ 2
À CtÁ GOI,T
ð
Þ À Ct RG,T
ð
Þ
ð
Þ À Ct GOI,NT
ð
Þ À Ct RG,NT
ð
Þ
ð
Þ
ð
Þ
ð1Þ
with:
Table 2
qPCR primer sequences
Genes
Primer sense
Primer sequence
RPLP0
Forward
TGGCAGCATCTACAACCCTGA
Reverse
ACACTGGCAACATTGCGGACA
Vimentin
Forward
CCAAACTTTTCCTCCCTGAACC
Reverse
GTGATGCTGAGAAGTTTCGTTGA
E-cadherin
Forward
GAACGCATTGCCACATACAC
Reverse
ATTCGGGCTTGTTGTCATTC
N-cadherin
Forward
AGCCAACCTTAACTGAGGAGT
Reverse
GGCAAGTTGATTGGAGGGATG
Occludin
Forward
AGAACTCTCCCGTTTGGATAAAGA
Reverse
TTTGTAATCTGCAGATCCCTTCAC
368
Noe ´ mie Kempf et al.