

3.3 Isolation of
Mesenchymal Cells
by MACS
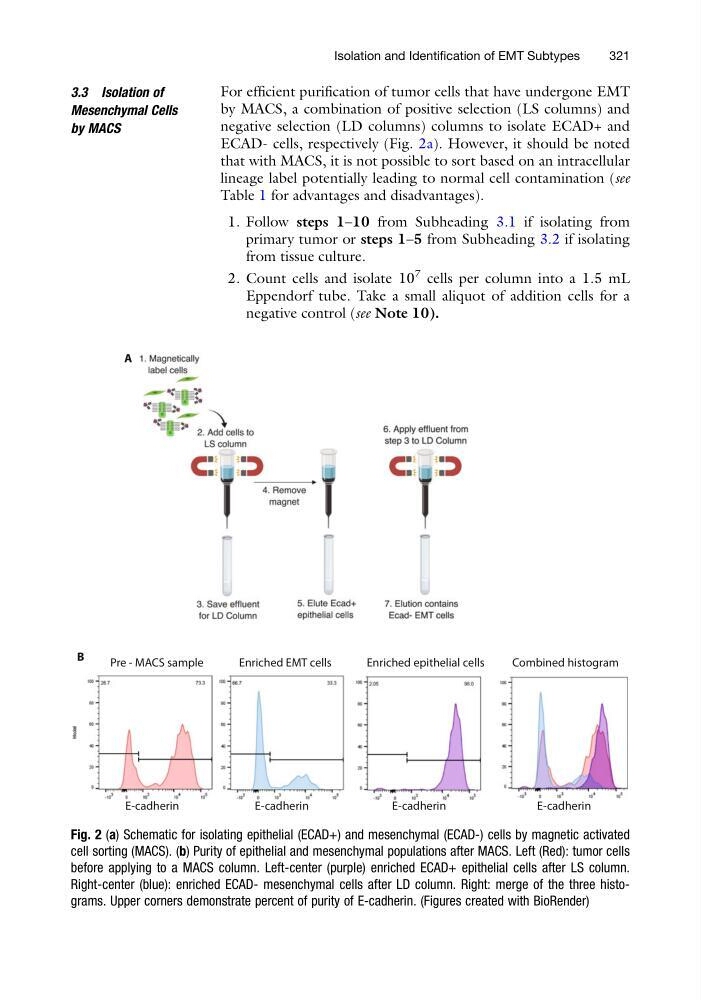
For efficient purification of tumor cells that have undergone EMT
by MACS, a combination of positive selection (LS columns) and
negative selection (LD columns) columns to isolate ECAD+ and
ECAD- cells, respectively (Fig. 2a). However, it should be noted
that with MACS, it is not possible to sort based on an intracellular
lineage label potentially leading to normal cell contamination (see
Table 1 for advantages and disadvantages).
1. Follow steps 1–10 from Subheading 3.1 if isolating from
primary tumor or steps 1–5 from Subheading 3.2 if isolating
from tissue culture.
2. Count cells and isolate 10
7 cells per column into a 1.5 mL
Eppendorf tube. Take a small aliquot of addition cells for a
negative control (see Note 10).
Pre - MACS sample
Enriched EMT cells
Enriched epithelial cells
Combined histogram
B
A
E-cadherin
E-cadherin
E-cadherin
E-cadherin
Fig. 2 (a) Schematic for isolating epithelial (ECAD+) and mesenchymal (ECAD-) cells by magnetic activated
cell sorting (MACS). (b) Purity of epithelial and mesenchymal populations after MACS. Left (Red): tumor cells
before applying to a MACS column. Left-center (purple) enriched ECAD+ epithelial cells after LS column.
Right-center (blue): enriched ECAD- mesenchymal cells after LD column. Right: merge of the three histograms. Upper corners demonstrate percent of purity of E-cadherin. (Figures created with BioRender)
Isolation and Identification of EMT Subtypes
321
Mesenchymal Cells
by MACS
For efficient purification of tumor cells that have undergone EMT
by MACS, a combination of positive selection (LS columns) and
negative selection (LD columns) columns to isolate ECAD+ and
ECAD- cells, respectively (Fig. 2a). However, it should be noted
that with MACS, it is not possible to sort based on an intracellular
lineage label potentially leading to normal cell contamination (see
Table 1 for advantages and disadvantages).
1. Follow steps 1–10 from Subheading 3.1 if isolating from
primary tumor or steps 1–5 from Subheading 3.2 if isolating
from tissue culture.
2. Count cells and isolate 10
7 cells per column into a 1.5 mL
Eppendorf tube. Take a small aliquot of addition cells for a
negative control (see Note 10).
Pre - MACS sample
Enriched EMT cells
Enriched epithelial cells
Combined histogram
B
A
E-cadherin
E-cadherin
E-cadherin
E-cadherin
Fig. 2 (a) Schematic for isolating epithelial (ECAD+) and mesenchymal (ECAD-) cells by magnetic activated
cell sorting (MACS). (b) Purity of epithelial and mesenchymal populations after MACS. Left (Red): tumor cells
before applying to a MACS column. Left-center (purple) enriched ECAD+ epithelial cells after LS column.
Right-center (blue): enriched ECAD- mesenchymal cells after LD column. Right: merge of the three histograms. Upper corners demonstrate percent of purity of E-cadherin. (Figures created with BioRender)
Isolation and Identification of EMT Subtypes
321