

2. Washing medium: DPBS.
3. 0.05% trypsin-EDTA solution in DPBS.
4. Madin-Darby canine kidney type II (MDCK II) stable cell lines
cultured into 25 cm
2 flasks (T25, TPP) at 37
C with 5% CO 2
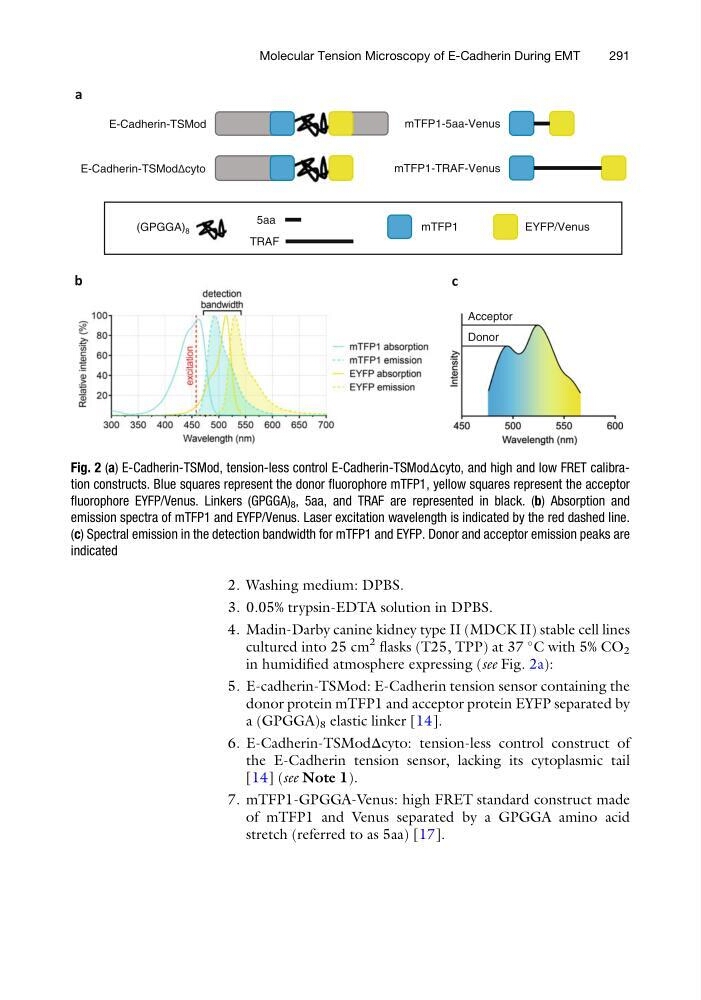
in humidified atmosphere expressing (see Fig. 2a):
5. E-cadherin-TSMod: E-Cadherin tension sensor containing the
donor protein mTFP1 and acceptor protein EYFP separated by
a (GPGGA) 8 elastic linker [14].
6. E-Cadherin-TSModΔcyto: tension-less control construct of
the E-Cadherin tension sensor, lacking its cytoplasmic tail
[14] (see Note 1).
7. mTFP1-GPGGA-Venus: high FRET standard construct made
of mTFP1 and Venus separated by a GPGGA amino acid
stretch (referred to as 5aa) [17].
E-Cadherin-TSMod
E-Cadherin-TSModΔcyto
mTFP1-5aa-Venus
mTFP1-TRAF-Venus
a
b
c
Donor
Acceptor
5aa
TRAF
(GPGGA) 8
mTFP1
EYFP/Venus
Fig. 2 (a) E-Cadherin-TSMod, tension-less control E-Cadherin-TSModΔcyto, and high and low FRET calibration constructs. Blue squares represent the donor fluorophore mTFP1, yellow squares represent the acceptor
fluorophore EYFP/Venus. Linkers (GPGGA) 8 , 5aa, and TRAF are represented in black. (b) Absorption and
emission spectra of mTFP1 and EYFP/Venus. Laser excitation wavelength is indicated by the red dashed line.
(c) Spectral emission in the detection bandwidth for mTFP1 and EYFP. Donor and acceptor emission peaks are
indicated
Molecular Tension Microscopy of E-Cadherin During EMT
291
3. 0.05% trypsin-EDTA solution in DPBS.
4. Madin-Darby canine kidney type II (MDCK II) stable cell lines
cultured into 25 cm
2 flasks (T25, TPP) at 37
C with 5% CO 2
in humidified atmosphere expressing (see Fig. 2a):
5. E-cadherin-TSMod: E-Cadherin tension sensor containing the
donor protein mTFP1 and acceptor protein EYFP separated by
a (GPGGA) 8 elastic linker [14].
6. E-Cadherin-TSModΔcyto: tension-less control construct of
the E-Cadherin tension sensor, lacking its cytoplasmic tail
[14] (see Note 1).
7. mTFP1-GPGGA-Venus: high FRET standard construct made
of mTFP1 and Venus separated by a GPGGA amino acid
stretch (referred to as 5aa) [17].
E-Cadherin-TSMod
E-Cadherin-TSModΔcyto
mTFP1-5aa-Venus
mTFP1-TRAF-Venus
a
b
c
Donor
Acceptor
5aa
TRAF
(GPGGA) 8
mTFP1
EYFP/Venus
Fig. 2 (a) E-Cadherin-TSMod, tension-less control E-Cadherin-TSModΔcyto, and high and low FRET calibration constructs. Blue squares represent the donor fluorophore mTFP1, yellow squares represent the acceptor
fluorophore EYFP/Venus. Linkers (GPGGA) 8 , 5aa, and TRAF are represented in black. (b) Absorption and
emission spectra of mTFP1 and EYFP/Venus. Laser excitation wavelength is indicated by the red dashed line.
(c) Spectral emission in the detection bandwidth for mTFP1 and EYFP. Donor and acceptor emission peaks are
indicated
Molecular Tension Microscopy of E-Cadherin During EMT
291