

A
B
C
D
E
1.0
normalized intensity
0.8
0.6
0.4
0.2
0
0
0.5
1.0
position (µm)
1.5
2.0
diff-lim
diff-lim
SRRF - 0.6
SRRF - 1.1
SRRF - 1.6
SRRF
1.0
normalized intensity
0.8
0.6
0.4
0.2
0 0
0.5
1.0
position (µm)
1.5
2.0
1.00
0.99
0.98
Pearson’s coefficient
0.97
0.96
0.6 0.8 1.0 1.2 1.4 1.6
SRRF ring size (pixels)
A'
B'
B''
B'''
diffraction-limited
actin
diff-lim
actin
SRRF
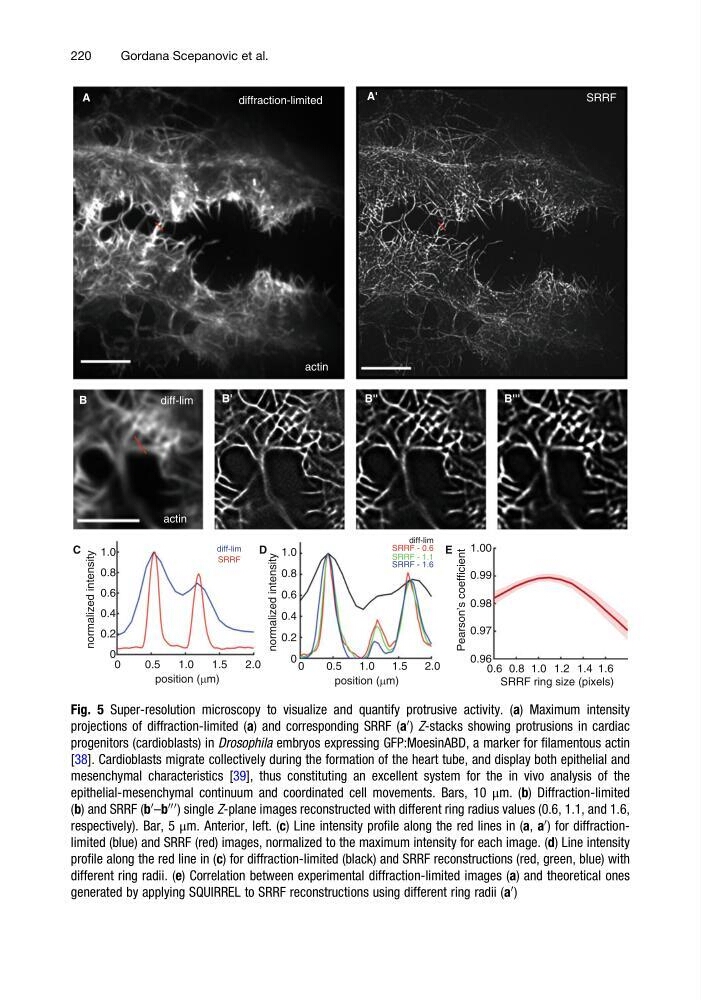
Fig. 5 Super-resolution microscopy to visualize and quantify protrusive activity. (a) Maximum intensity
projections of diffraction-limited (a) and corresponding SRRF (a
0 ) Z-stacks showing protrusions in cardiac
progenitors (cardioblasts) in Drosophila embryos expressing GFP:MoesinABD, a marker for filamentous actin
[38]. Cardioblasts migrate collectively during the formation of the heart tube, and display both epithelial and
mesenchymal characteristics [39], thus constituting an excellent system for the in vivo analysis of the
epithelial-mesenchymal continuum and coordinated cell movements. Bars, 10 μm. (b) Diffraction-limited
(b) and SRRF (b
0 –b
000 ) single Z-plane images reconstructed with different ring radius values (0.6, 1.1, and 1.6,
respectively). Bar, 5 μm. Anterior, left. (c) Line intensity profile along the red lines in (a, a
0 ) for diffractionlimited (blue) and SRRF (red) images, normalized to the maximum intensity for each image. (d) Line intensity
profile along the red line in (c) for diffraction-limited (black) and SRRF reconstructions (red, green, blue) with
different ring radii. (e) Correlation between experimental diffraction-limited images (a) and theoretical ones
generated by applying SQUIRREL to SRRF reconstructions using different ring radii (a
0 )
220
Gordana Scepanovic et al.
B
C
D
E
1.0
normalized intensity
0.8
0.6
0.4
0.2
0
0
0.5
1.0
position (µm)
1.5
2.0
diff-lim
diff-lim
SRRF - 0.6
SRRF - 1.1
SRRF - 1.6
SRRF
1.0
normalized intensity
0.8
0.6
0.4
0.2
0 0
0.5
1.0
position (µm)
1.5
2.0
1.00
0.99
0.98
Pearson’s coefficient
0.97
0.96
0.6 0.8 1.0 1.2 1.4 1.6
SRRF ring size (pixels)
A'
B'
B''
B'''
diffraction-limited
actin
diff-lim
actin
SRRF
Fig. 5 Super-resolution microscopy to visualize and quantify protrusive activity. (a) Maximum intensity
projections of diffraction-limited (a) and corresponding SRRF (a
0 ) Z-stacks showing protrusions in cardiac
progenitors (cardioblasts) in Drosophila embryos expressing GFP:MoesinABD, a marker for filamentous actin
[38]. Cardioblasts migrate collectively during the formation of the heart tube, and display both epithelial and
mesenchymal characteristics [39], thus constituting an excellent system for the in vivo analysis of the
epithelial-mesenchymal continuum and coordinated cell movements. Bars, 10 μm. (b) Diffraction-limited
(b) and SRRF (b
0 –b
000 ) single Z-plane images reconstructed with different ring radius values (0.6, 1.1, and 1.6,
respectively). Bar, 5 μm. Anterior, left. (c) Line intensity profile along the red lines in (a, a
0 ) for diffractionlimited (blue) and SRRF (red) images, normalized to the maximum intensity for each image. (d) Line intensity
profile along the red line in (c) for diffraction-limited (black) and SRRF reconstructions (red, green, blue) with
different ring radii. (e) Correlation between experimental diffraction-limited images (a) and theoretical ones
generated by applying SQUIRREL to SRRF reconstructions using different ring radii (a
0 )
220
Gordana Scepanovic et al.