

28. To calculate fluorescence at the wound margin, the mean
fluorescence of the pixels under the LiveWire annotation
(we typically use 0.6-μm-wide mask) is calculated. Images
should be corrected for photobleaching by dividing by the
mean image intensity at each time point. Background subtraction should also be used when quantifying fluorescence. For
cortically enriched signals, the image mode (the most frequent
pixel value) can be used as the background value, as there are
many more cytoplasmic pixels than cortical ones.
29. Other features of the fluorescence distribution at the wound
edge can be useful to determine the efficiency of collective cell
movements. For instance, we previously showed that heterogeneity in the distribution at the wound edge of the
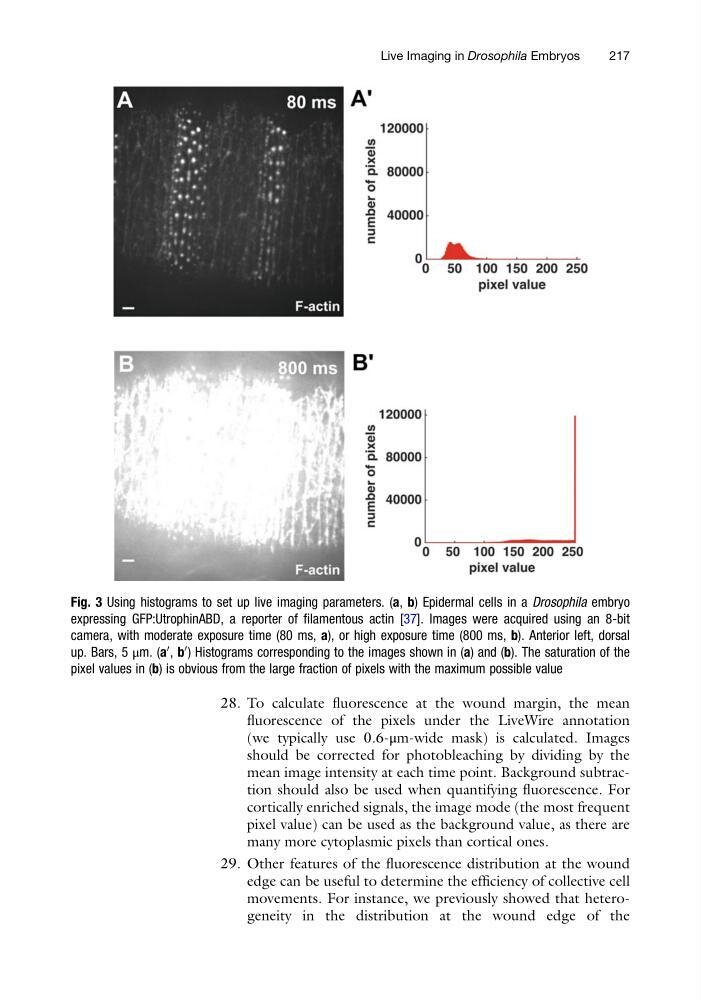
Fig. 3 Using histograms to set up live imaging parameters. (a, b) Epidermal cells in a Drosophila embryo
expressing GFP:UtrophinABD, a reporter of filamentous actin [37]. Images were acquired using an 8-bit
camera, with moderate exposure time (80 ms, a), or high exposure time (800 ms, b). Anterior left, dorsal
up. Bars, 5 μm. (a
0 , b
0 ) Histograms corresponding to the images shown in (a) and (b). The saturation of the
pixel values in (b) is obvious from the large fraction of pixels with the maximum possible value
Live Imaging in Drosophila Embryos
217
fluorescence of the pixels under the LiveWire annotation
(we typically use 0.6-μm-wide mask) is calculated. Images
should be corrected for photobleaching by dividing by the
mean image intensity at each time point. Background subtraction should also be used when quantifying fluorescence. For
cortically enriched signals, the image mode (the most frequent
pixel value) can be used as the background value, as there are
many more cytoplasmic pixels than cortical ones.
29. Other features of the fluorescence distribution at the wound
edge can be useful to determine the efficiency of collective cell
movements. For instance, we previously showed that heterogeneity in the distribution at the wound edge of the
Fig. 3 Using histograms to set up live imaging parameters. (a, b) Epidermal cells in a Drosophila embryo
expressing GFP:UtrophinABD, a reporter of filamentous actin [37]. Images were acquired using an 8-bit
camera, with moderate exposure time (80 ms, a), or high exposure time (800 ms, b). Anterior left, dorsal
up. Bars, 5 μm. (a
0 , b
0 ) Histograms corresponding to the images shown in (a) and (b). The saturation of the
pixel values in (b) is obvious from the large fraction of pixels with the maximum possible value
Live Imaging in Drosophila Embryos
217