

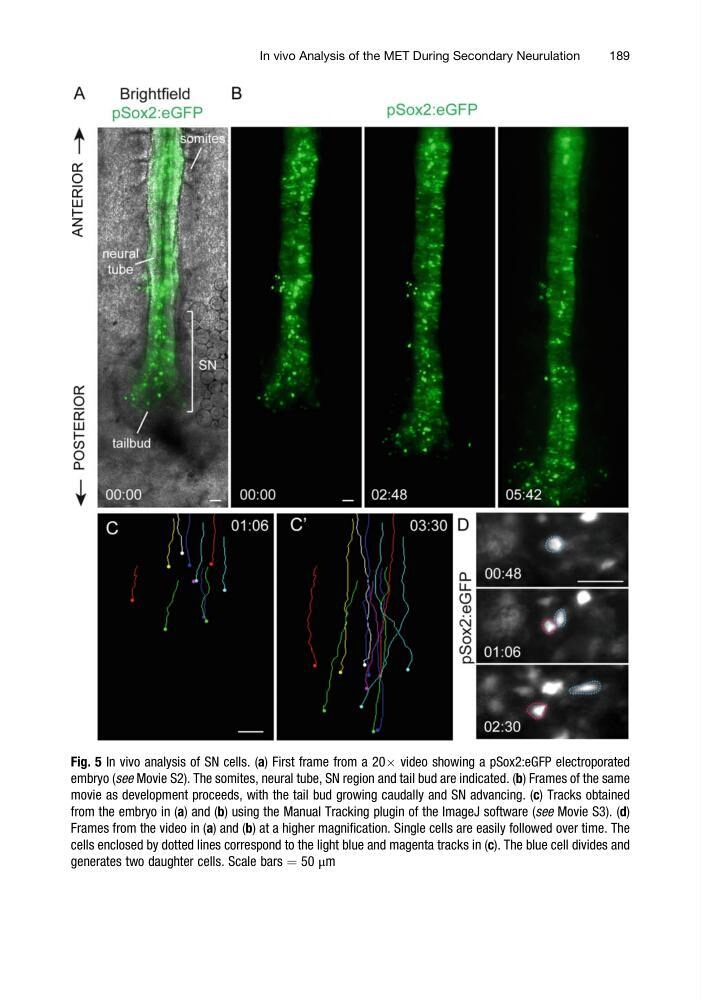
Fig. 5 In vivo analysis of SN cells. (a) First frame from a 20Â video showing a pSox2:eGFP electroporated
embryo (see Movie S2). The somites, neural tube, SN region and tail bud are indicated. (b) Frames of the same
movie as development proceeds, with the tail bud growing caudally and SN advancing. (c) Tracks obtained
from the embryo in (a) and (b) using the Manual Tracking plugin of the ImageJ software (see Movie S3). (d)
Frames from the video in (a) and (b) at a higher magnification. Single cells are easily followed over time. The
cells enclosed by dotted lines correspond to the light blue and magenta tracks in (c). The blue cell divides and
generates two daughter cells. Scale bars ¼ 50 μm
In vivo Analysis of the MET During Secondary Neurulation
189
embryo (see Movie S2). The somites, neural tube, SN region and tail bud are indicated. (b) Frames of the same
movie as development proceeds, with the tail bud growing caudally and SN advancing. (c) Tracks obtained
from the embryo in (a) and (b) using the Manual Tracking plugin of the ImageJ software (see Movie S3). (d)
Frames from the video in (a) and (b) at a higher magnification. Single cells are easily followed over time. The
cells enclosed by dotted lines correspond to the light blue and magenta tracks in (c). The blue cell divides and
generates two daughter cells. Scale bars ¼ 50 μm
In vivo Analysis of the MET During Secondary Neurulation
189