

point n, immediately after photobleaching, and before photobleaching, respectively (Fig. 3).
6. Perform nonlinear regression analysis to test for the best fit
model using suitable statistical package, e.g., GraphPad Prism
(https://www.graphpad.com/scientific-software/prism). Fit
the recovery to a single exponential model in a form of
f t
ð Þ ¼ 1 À F im À A 1 e
Àt=T fast , and to bi-exponential model in a
form of f t
ð Þ ¼ 1 À F im À A 1 e
Àt=T fast À A 2 e
Àt=T slow , where F im is
a size of the immobile fraction, T fast and T slow are the halftimes, and A 1 and A 2 are the amplitudes of the fast and slow
components of the recovery. Use an F-test to choose the model
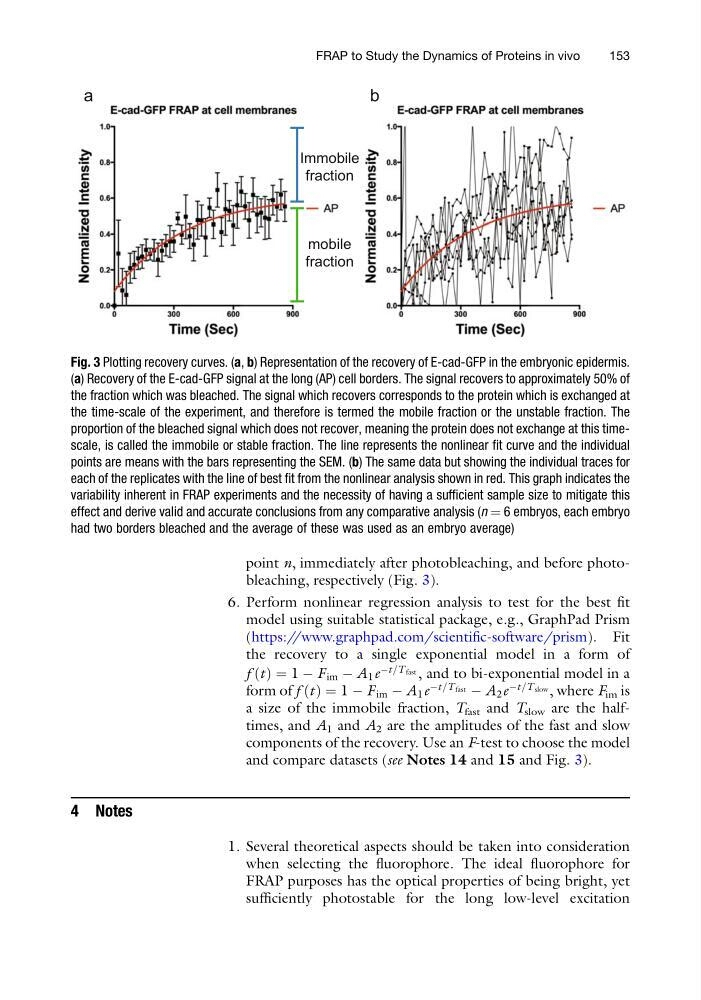
and compare datasets (see Notes 14 and 15 and Fig. 3).
4 Notes
1. Several theoretical aspects should be taken into consideration
when selecting the fluorophore. The ideal fluorophore for
FRAP purposes has the optical properties of being bright, yet
sufficiently photostable for the long low-level excitation
b
a
Immobile
fraction
mobile
fraction
Fig. 3 Plotting recovery curves. (a, b) Representation of the recovery of E-cad-GFP in the embryonic epidermis.
(a) Recovery of the E-cad-GFP signal at the long (AP) cell borders. The signal recovers to approximately 50% of
the fraction which was bleached. The signal which recovers corresponds to the protein which is exchanged at
the time-scale of the experiment, and therefore is termed the mobile fraction or the unstable fraction. The
proportion of the bleached signal which does not recover, meaning the protein does not exchange at this timescale, is called the immobile or stable fraction. The line represents the nonlinear fit curve and the individual
points are means with the bars representing the SEM. (b) The same data but showing the individual traces for
each of the replicates with the line of best fit from the nonlinear analysis shown in red. This graph indicates the
variability inherent in FRAP experiments and the necessity of having a sufficient sample size to mitigate this
effect and derive valid and accurate conclusions from any comparative analysis (n ¼ 6 embryos, each embryo
had two borders bleached and the average of these was used as an embryo average)
FRAP to Study the Dynamics of Proteins in vivo
153
6. Perform nonlinear regression analysis to test for the best fit
model using suitable statistical package, e.g., GraphPad Prism
(https://www.graphpad.com/scientific-software/prism). Fit
the recovery to a single exponential model in a form of
f t
ð Þ ¼ 1 À F im À A 1 e
Àt=T fast , and to bi-exponential model in a
form of f t
ð Þ ¼ 1 À F im À A 1 e
Àt=T fast À A 2 e
Àt=T slow , where F im is
a size of the immobile fraction, T fast and T slow are the halftimes, and A 1 and A 2 are the amplitudes of the fast and slow
components of the recovery. Use an F-test to choose the model
and compare datasets (see Notes 14 and 15 and Fig. 3).
4 Notes
1. Several theoretical aspects should be taken into consideration
when selecting the fluorophore. The ideal fluorophore for
FRAP purposes has the optical properties of being bright, yet
sufficiently photostable for the long low-level excitation
b
a
Immobile
fraction
mobile
fraction
Fig. 3 Plotting recovery curves. (a, b) Representation of the recovery of E-cad-GFP in the embryonic epidermis.
(a) Recovery of the E-cad-GFP signal at the long (AP) cell borders. The signal recovers to approximately 50% of
the fraction which was bleached. The signal which recovers corresponds to the protein which is exchanged at
the time-scale of the experiment, and therefore is termed the mobile fraction or the unstable fraction. The
proportion of the bleached signal which does not recover, meaning the protein does not exchange at this timescale, is called the immobile or stable fraction. The line represents the nonlinear fit curve and the individual
points are means with the bars representing the SEM. (b) The same data but showing the individual traces for
each of the replicates with the line of best fit from the nonlinear analysis shown in red. This graph indicates the
variability inherent in FRAP experiments and the necessity of having a sufficient sample size to mitigate this
effect and derive valid and accurate conclusions from any comparative analysis (n ¼ 6 embryos, each embryo
had two borders bleached and the average of these was used as an embryo average)
FRAP to Study the Dynamics of Proteins in vivo
153