

Pre-Bleach
T0
Bleach
T1
End
T45
Stage 15 Embryo
Aquistion
T20
E-cadherin-GFP
Beach area ROI
Control area ROI
Background area ROI
b
a
c
d
e
Anterior
Posterior
Ventral
Dorsal
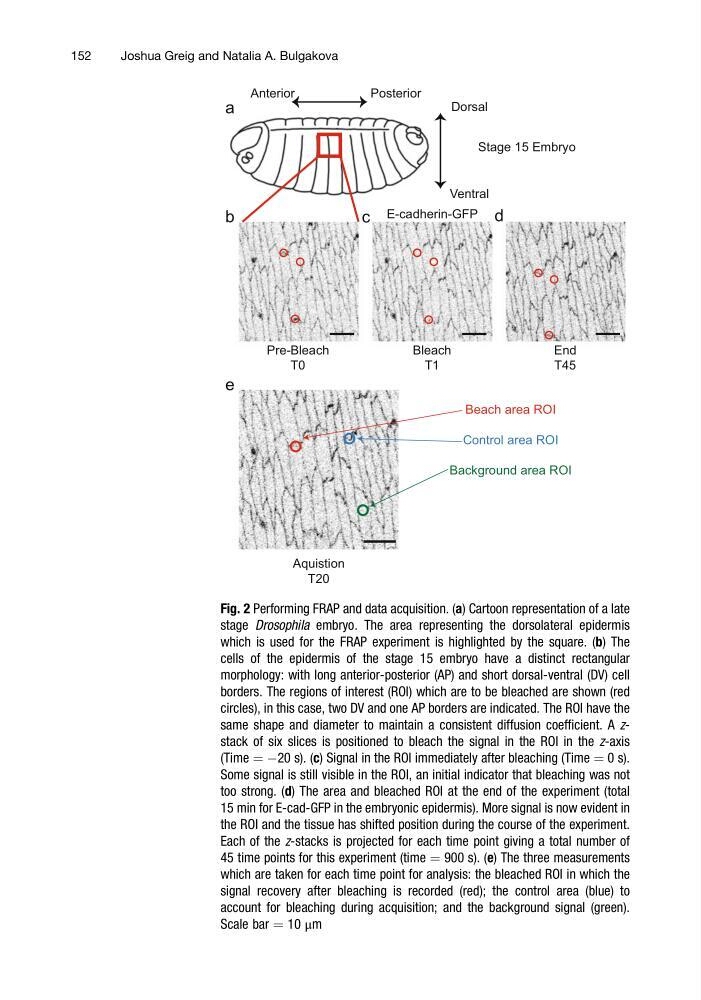
Fig. 2 Performing FRAP and data acquisition. (a) Cartoon representation of a late
stage Drosophila embryo. The area representing the dorsolateral epidermis
which is used for the FRAP experiment is highlighted by the square. (b) The
cells of the epidermis of the stage 15 embryo have a distinct rectangular
morphology: with long anterior-posterior (AP) and short dorsal-ventral (DV) cell
borders. The regions of interest (ROI) which are to be bleached are shown (red
circles), in this case, two DV and one AP borders are indicated. The ROI have the
same shape and diameter to maintain a consistent diffusion coefficient. A zstack of six slices is positioned to bleach the signal in the ROI in the z-axis
(Time ¼ À20 s). (c) Signal in the ROI immediately after bleaching (Time ¼ 0 s).
Some signal is still visible in the ROI, an initial indicator that bleaching was not
too strong. (d) The area and bleached ROI at the end of the experiment (total
15 min for E-cad-GFP in the embryonic epidermis). More signal is now evident in
the ROI and the tissue has shifted position during the course of the experiment.
Each of the z-stacks is projected for each time point giving a total number of
45 time points for this experiment (time ¼ 900 s). (e) The three measurements
which are taken for each time point for analysis: the bleached ROI in which the
signal recovery after bleaching is recorded (red); the control area (blue) to
account for bleaching during acquisition; and the background signal (green).
Scale bar ¼ 10 μm
152
Joshua Greig and Natalia A. Bulgakova
T0
Bleach
T1
End
T45
Stage 15 Embryo
Aquistion
T20
E-cadherin-GFP
Beach area ROI
Control area ROI
Background area ROI
b
a
c
d
e
Anterior
Posterior
Ventral
Dorsal
Fig. 2 Performing FRAP and data acquisition. (a) Cartoon representation of a late
stage Drosophila embryo. The area representing the dorsolateral epidermis
which is used for the FRAP experiment is highlighted by the square. (b) The
cells of the epidermis of the stage 15 embryo have a distinct rectangular
morphology: with long anterior-posterior (AP) and short dorsal-ventral (DV) cell
borders. The regions of interest (ROI) which are to be bleached are shown (red
circles), in this case, two DV and one AP borders are indicated. The ROI have the
same shape and diameter to maintain a consistent diffusion coefficient. A zstack of six slices is positioned to bleach the signal in the ROI in the z-axis
(Time ¼ À20 s). (c) Signal in the ROI immediately after bleaching (Time ¼ 0 s).
Some signal is still visible in the ROI, an initial indicator that bleaching was not
too strong. (d) The area and bleached ROI at the end of the experiment (total
15 min for E-cad-GFP in the embryonic epidermis). More signal is now evident in
the ROI and the tissue has shifted position during the course of the experiment.
Each of the z-stacks is projected for each time point giving a total number of
45 time points for this experiment (time ¼ 900 s). (e) The three measurements
which are taken for each time point for analysis: the bleached ROI in which the
signal recovery after bleaching is recorded (red); the control area (blue) to
account for bleaching during acquisition; and the background signal (green).
Scale bar ¼ 10 μm
152
Joshua Greig and Natalia A. Bulgakova