

12 Ligand Effects in Ruthenium Nanoparticle Catalysis
411
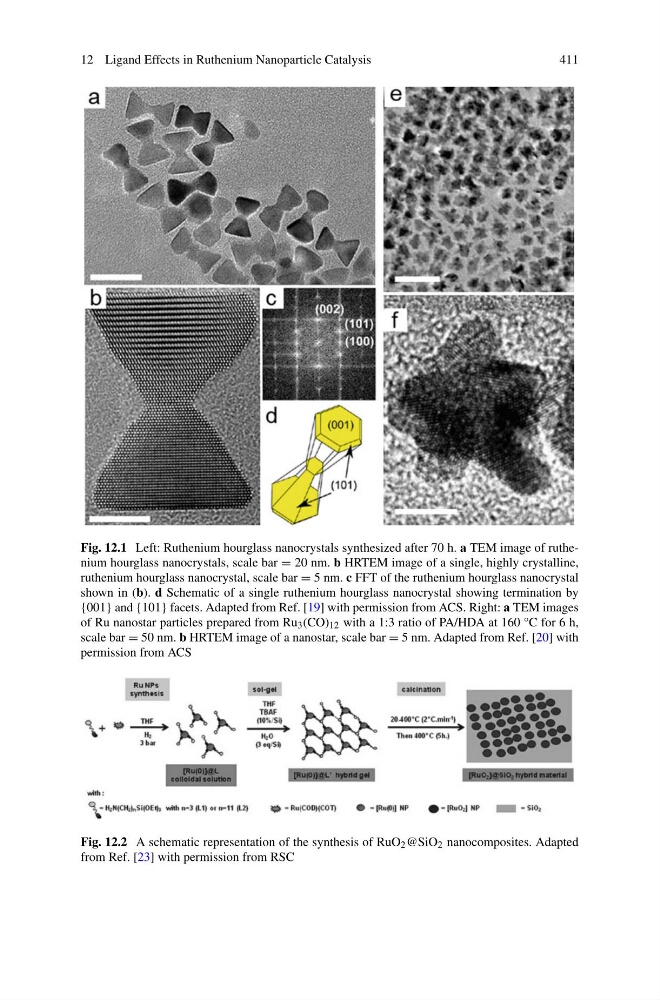
Fig. 12.1 Left: Ruthenium hourglass nanocrystals synthesized after 70 h. a TEM image of ruthenium hourglass nanocrystals, scale bar = 20 nm. b HRTEM image of a single, highly crystalline,
ruthenium hourglass nanocrystal, scale bar = 5 nm. c FFT of the ruthenium hourglass nanocrystal
shown in (b). d Schematic of a single ruthenium hourglass nanocrystal showing termination by
{001} and {101} facets. Adapted from Ref. [19] with permission from ACS. Right: a TEM images
of Ru nanostar particles prepared from Ru 3 (CO) 12 with a 1:3 ratio of PA/HDA at 160 °C for 6 h,
scale bar = 50 nm. b HRTEM image of a nanostar, scale bar = 5 nm. Adapted from Ref. [20] with
permission from ACS
Fig. 12.2 A schematic representation of the synthesis of RuO 2 @SiO 2 nanocomposites. Adapted
from Ref. [23] with permission from RSC
411
Fig. 12.1 Left: Ruthenium hourglass nanocrystals synthesized after 70 h. a TEM image of ruthenium hourglass nanocrystals, scale bar = 20 nm. b HRTEM image of a single, highly crystalline,
ruthenium hourglass nanocrystal, scale bar = 5 nm. c FFT of the ruthenium hourglass nanocrystal
shown in (b). d Schematic of a single ruthenium hourglass nanocrystal showing termination by
{001} and {101} facets. Adapted from Ref. [19] with permission from ACS. Right: a TEM images
of Ru nanostar particles prepared from Ru 3 (CO) 12 with a 1:3 ratio of PA/HDA at 160 °C for 6 h,
scale bar = 50 nm. b HRTEM image of a nanostar, scale bar = 5 nm. Adapted from Ref. [20] with
permission from ACS
Fig. 12.2 A schematic representation of the synthesis of RuO 2 @SiO 2 nanocomposites. Adapted
from Ref. [23] with permission from RSC