

2. The CellCut mode of the software allows for the calibration of
the slide geometry of the dish that keeps the plane of focus
steady as the laser cuts around the protrusions. With the Â4
objective, focus the dish and set the proper plane tilt of the
dish. Then, scan the dish to visualize the entire cell-covered
area and help in determining what area to cut.
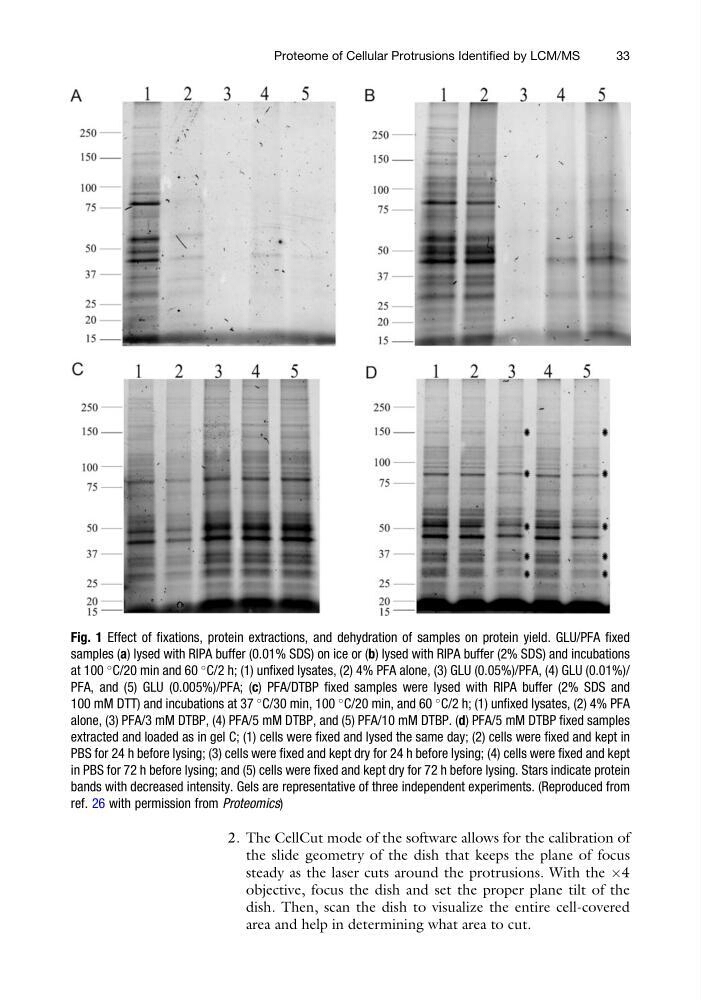
Fig. 1 Effect of fixations, protein extractions, and dehydration of samples on protein yield. GLU/PFA fixed
samples (a) lysed with RIPA buffer (0.01% SDS) on ice or (b) lysed with RIPA buffer (2% SDS) and incubations
at 100
C/20 min and 60
C/2 h; (1) unfixed lysates, (2) 4% PFA alone, (3) GLU (0.05%)/PFA, (4) GLU (0.01%)/
PFA, and (5) GLU (0.005%)/PFA; (c) PFA/DTBP fixed samples were lysed with RIPA buffer (2% SDS and
100 mM DTT) and incubations at 37
C/30 min, 100
C/20 min, and 60
C/2 h; (1) unfixed lysates, (2) 4% PFA
alone, (3) PFA/3 mM DTBP, (4) PFA/5 mM DTBP, and (5) PFA/10 mM DTBP. (d) PFA/5 mM DTBP fixed samples
extracted and loaded as in gel C; (1) cells were fixed and lysed the same day; (2) cells were fixed and kept in
PBS for 24 h before lysing; (3) cells were fixed and kept dry for 24 h before lysing; (4) cells were fixed and kept
in PBS for 72 h before lysing; and (5) cells were fixed and kept dry for 72 h before lysing. Stars indicate protein
bands with decreased intensity. Gels are representative of three independent experiments. (Reproduced from
ref. 26 with permission from Proteomics)
Proteome of Cellular Protrusions Identified by LCM/MS
33
the slide geometry of the dish that keeps the plane of focus
steady as the laser cuts around the protrusions. With the Â4
objective, focus the dish and set the proper plane tilt of the
dish. Then, scan the dish to visualize the entire cell-covered
area and help in determining what area to cut.
Fig. 1 Effect of fixations, protein extractions, and dehydration of samples on protein yield. GLU/PFA fixed
samples (a) lysed with RIPA buffer (0.01% SDS) on ice or (b) lysed with RIPA buffer (2% SDS) and incubations
at 100
C/20 min and 60
C/2 h; (1) unfixed lysates, (2) 4% PFA alone, (3) GLU (0.05%)/PFA, (4) GLU (0.01%)/
PFA, and (5) GLU (0.005%)/PFA; (c) PFA/DTBP fixed samples were lysed with RIPA buffer (2% SDS and
100 mM DTT) and incubations at 37
C/30 min, 100
C/20 min, and 60
C/2 h; (1) unfixed lysates, (2) 4% PFA
alone, (3) PFA/3 mM DTBP, (4) PFA/5 mM DTBP, and (5) PFA/10 mM DTBP. (d) PFA/5 mM DTBP fixed samples
extracted and loaded as in gel C; (1) cells were fixed and lysed the same day; (2) cells were fixed and kept in
PBS for 24 h before lysing; (3) cells were fixed and kept dry for 24 h before lysing; (4) cells were fixed and kept
in PBS for 72 h before lysing; and (5) cells were fixed and kept dry for 72 h before lysing. Stars indicate protein
bands with decreased intensity. Gels are representative of three independent experiments. (Reproduced from
ref. 26 with permission from Proteomics)
Proteome of Cellular Protrusions Identified by LCM/MS
33