

3. Protein quantification is performed on the remaining peptides
using the sum of the N most intense precursors per protein.
protTraces <- proteinQuantification(pepTraces_cons_sib, topN
= 2, keep_less = FALSE, rm_decoys = TRUE)
Sibling Peptide Correlation Density
Complex sub-feature summary
Prefoldin complex
scaled frequency
N complex queries
SibPepCorr
N co-elution features
0.0
0.5
1.0
1
76
2
23
3
11
4
1
0
20
40
60
5000 15000
25000
target peptides
decoy peptides
(1)
(3)
6714
1884
507
139
38
11
0e+00
5e+06
1e+07
MW (kDa)
1
1 1
2 1
3 1
4 1
5 1
fraction
intensity
(2)
1
1 1
2 1
3 1
4 1
5 1
fraction
PFDN2
PFDN4
PFDN6
VBP1
PFDN5
PFDN1
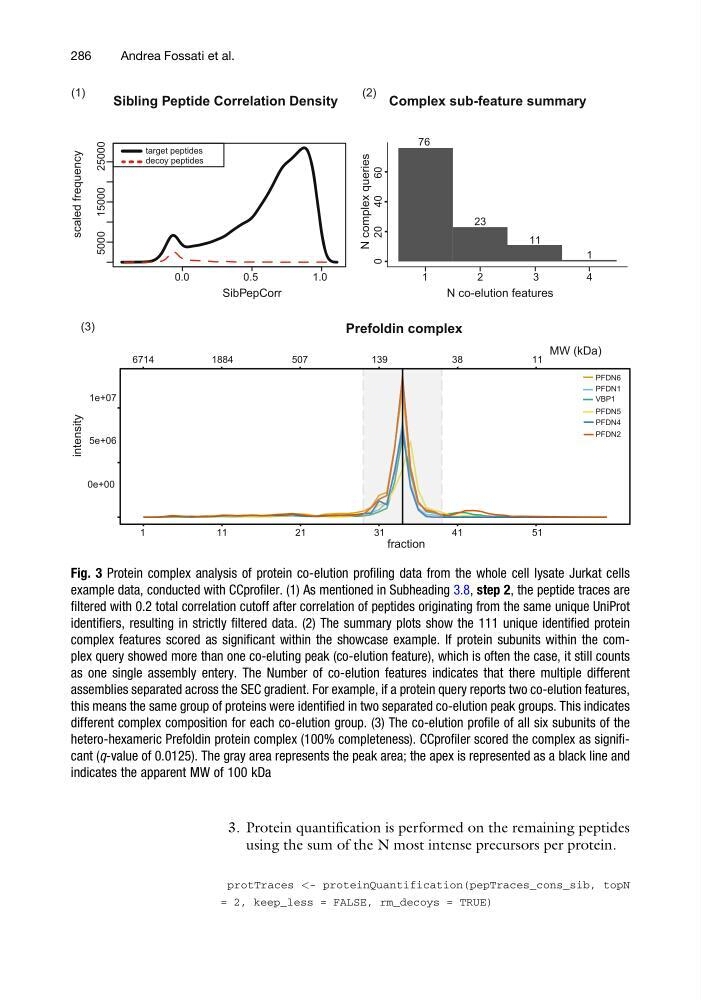
Fig. 3 Protein complex analysis of protein co-elution profiling data from the whole cell lysate Jurkat cells
example data, conducted with CCprofiler. (1) As mentioned in Subheading 3.8, step 2, the peptide traces are
filtered with 0.2 total correlation cutoff after correlation of peptides originating from the same unique UniProt
identifiers, resulting in strictly filtered data. (2) The summary plots show the 111 unique identified protein
complex features scored as significant within the showcase example. If protein subunits within the complex query showed more than one co-eluting peak (co-elution feature), which is often the case, it still counts
as one single assembly entery. The Number of co-elution features indicates that there multiple different
assemblies separated across the SEC gradient. For example, if a protein query reports two co-elution features,
this means the same group of proteins were identified in two separated co-elution peak groups. This indicates
different complex composition for each co-elution group. (3) The co-elution profile of all six subunits of the
hetero-hexameric Prefoldin protein complex (100% completeness). CCprofiler scored the complex as significant (q-value of 0.0125). The gray area represents the peak area; the apex is represented as a black line and
indicates the apparent MW of 100 kDa
286
Andrea Fossati et al.
using the sum of the N most intense precursors per protein.
protTraces <- proteinQuantification(pepTraces_cons_sib, topN
= 2, keep_less = FALSE, rm_decoys = TRUE)
Sibling Peptide Correlation Density
Complex sub-feature summary
Prefoldin complex
scaled frequency
N complex queries
SibPepCorr
N co-elution features
0.0
0.5
1.0
1
76
2
23
3
11
4
1
0
20
40
60
5000 15000
25000
target peptides
decoy peptides
(1)
(3)
6714
1884
507
139
38
11
0e+00
5e+06
1e+07
MW (kDa)
1
1 1
2 1
3 1
4 1
5 1
fraction
intensity
(2)
1
1 1
2 1
3 1
4 1
5 1
fraction
PFDN2
PFDN4
PFDN6
VBP1
PFDN5
PFDN1
Fig. 3 Protein complex analysis of protein co-elution profiling data from the whole cell lysate Jurkat cells
example data, conducted with CCprofiler. (1) As mentioned in Subheading 3.8, step 2, the peptide traces are
filtered with 0.2 total correlation cutoff after correlation of peptides originating from the same unique UniProt
identifiers, resulting in strictly filtered data. (2) The summary plots show the 111 unique identified protein
complex features scored as significant within the showcase example. If protein subunits within the complex query showed more than one co-eluting peak (co-elution feature), which is often the case, it still counts
as one single assembly entery. The Number of co-elution features indicates that there multiple different
assemblies separated across the SEC gradient. For example, if a protein query reports two co-elution features,
this means the same group of proteins were identified in two separated co-elution peak groups. This indicates
different complex composition for each co-elution group. (3) The co-elution profile of all six subunits of the
hetero-hexameric Prefoldin protein complex (100% completeness). CCprofiler scored the complex as significant (q-value of 0.0125). The gray area represents the peak area; the apex is represented as a black line and
indicates the apparent MW of 100 kDa
286
Andrea Fossati et al.