

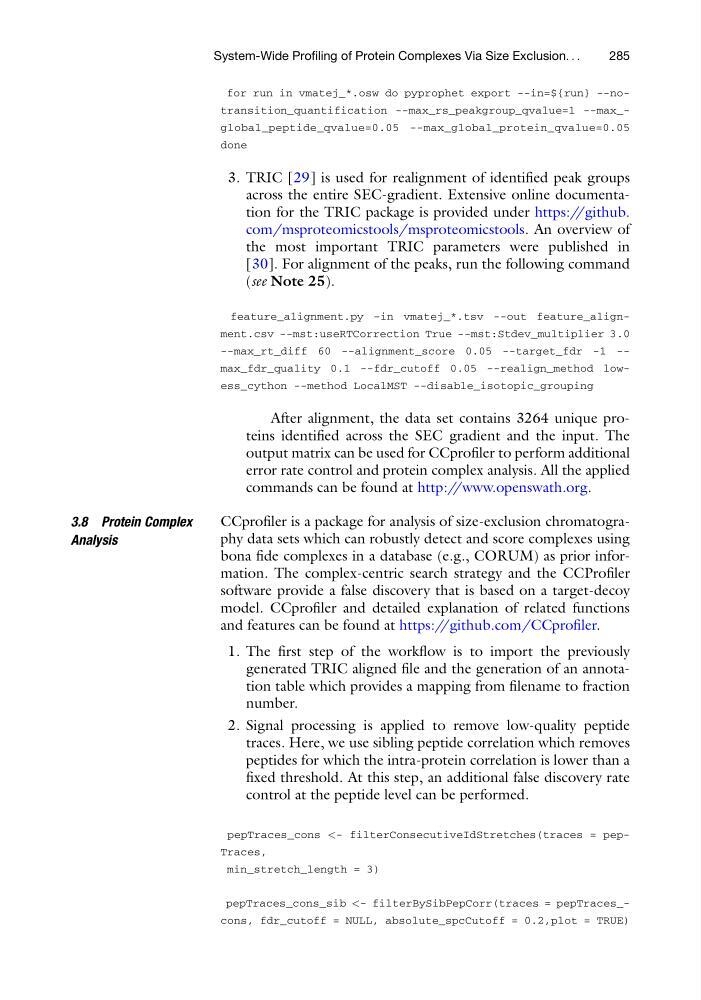
for run in vmatej_*.osw do pyprophet export --in=${run} --notransition_quantification --max_rs_peakgroup_qvalue=1 --max_global_peptide_qvalue=0.05 --max_global_protein_qvalue=0.05
done
3. TRIC [29] is used for realignment of identified peak groups
across the entire SEC-gradient. Extensive online documentation for the TRIC package is provided under https://github.
com/msproteomicstools/msproteomicstools. An overview of
the most important TRIC parameters were published in
[30]. For alignment of the peaks, run the following command
(see Note 25).
feature_alignment.py –in vmatej_*.tsv --out feature_alignment.csv --mst:useRTCorrection True --mst:Stdev_multiplier 3.0
--max_rt_diff 60 --alignment_score 0.05 --target_fdr -1 -max_fdr_quality 0.1 --fdr_cutoff 0.05 --realign_method lowess_cython --method LocalMST --disable_isotopic_grouping
After alignment, the data set contains 3264 unique proteins identified across the SEC gradient and the input. The
output matrix can be used for CCprofiler to perform additional
error rate control and protein complex analysis. All the applied
commands can be found at http://www.openswath.org.
3.8 Protein Complex
Analysis
CCprofiler is a package for analysis of size-exclusion chromatography data sets which can robustly detect and score complexes using
bona fide complexes in a database (e.g., CORUM) as prior information. The complex-centric search strategy and the CCProfiler
software provide a false discovery that is based on a target-decoy
model. CCprofiler and detailed explanation of related functions
and features can be found at https://github.com/CCprofiler.
1. The first step of the workflow is to import the previously
generated TRIC aligned file and the generation of an annotation table which provides a mapping from filename to fraction
number.
2. Signal processing is applied to remove low-quality peptide
traces. Here, we use sibling peptide correlation which removes
peptides for which the intra-protein correlation is lower than a
fixed threshold. At this step, an additional false discovery rate
control at the peptide level can be performed.
pepTraces_cons <- filterConsecutiveIdStretches(traces = pepTraces,
min_stretch_length = 3)
pepTraces_cons_sib <- filterBySibPepCorr(traces = pepTraces_cons, fdr_cutoff = NULL, absolute_spcCutoff = 0.2,plot = TRUE)
System-Wide Profiling of Protein Complexes Via Size Exclusion. . .
285
done
3. TRIC [29] is used for realignment of identified peak groups
across the entire SEC-gradient. Extensive online documentation for the TRIC package is provided under https://github.
com/msproteomicstools/msproteomicstools. An overview of
the most important TRIC parameters were published in
[30]. For alignment of the peaks, run the following command
(see Note 25).
feature_alignment.py –in vmatej_*.tsv --out feature_alignment.csv --mst:useRTCorrection True --mst:Stdev_multiplier 3.0
--max_rt_diff 60 --alignment_score 0.05 --target_fdr -1 -max_fdr_quality 0.1 --fdr_cutoff 0.05 --realign_method lowess_cython --method LocalMST --disable_isotopic_grouping
After alignment, the data set contains 3264 unique proteins identified across the SEC gradient and the input. The
output matrix can be used for CCprofiler to perform additional
error rate control and protein complex analysis. All the applied
commands can be found at http://www.openswath.org.
3.8 Protein Complex
Analysis
CCprofiler is a package for analysis of size-exclusion chromatography data sets which can robustly detect and score complexes using
bona fide complexes in a database (e.g., CORUM) as prior information. The complex-centric search strategy and the CCProfiler
software provide a false discovery that is based on a target-decoy
model. CCprofiler and detailed explanation of related functions
and features can be found at https://github.com/CCprofiler.
1. The first step of the workflow is to import the previously
generated TRIC aligned file and the generation of an annotation table which provides a mapping from filename to fraction
number.
2. Signal processing is applied to remove low-quality peptide
traces. Here, we use sibling peptide correlation which removes
peptides for which the intra-protein correlation is lower than a
fixed threshold. At this step, an additional false discovery rate
control at the peptide level can be performed.
pepTraces_cons <- filterConsecutiveIdStretches(traces = pepTraces,
min_stretch_length = 3)
pepTraces_cons_sib <- filterBySibPepCorr(traces = pepTraces_cons, fdr_cutoff = NULL, absolute_spcCutoff = 0.2,plot = TRUE)
System-Wide Profiling of Protein Complexes Via Size Exclusion. . .
285