

8. Determine the protein concentration by using a BCA Kit, and
verify the protein integrity by SDS-PAGE of 2 μg from each
sample and silver staining (see Note 3 and Fig. 2a).
3.5 Protein Digestion
and TMT Labeling
1. Precipitate 100 μg of each sample with six volumes of cold
(À20
C) acetone overnight at À20
C. Spin down the samples
at 15,000 Â g for 15 min at 4
C (see Note 4).
2. Air-dry the pellet for a few seconds and add 100 μL of
0.1 M TEAB.
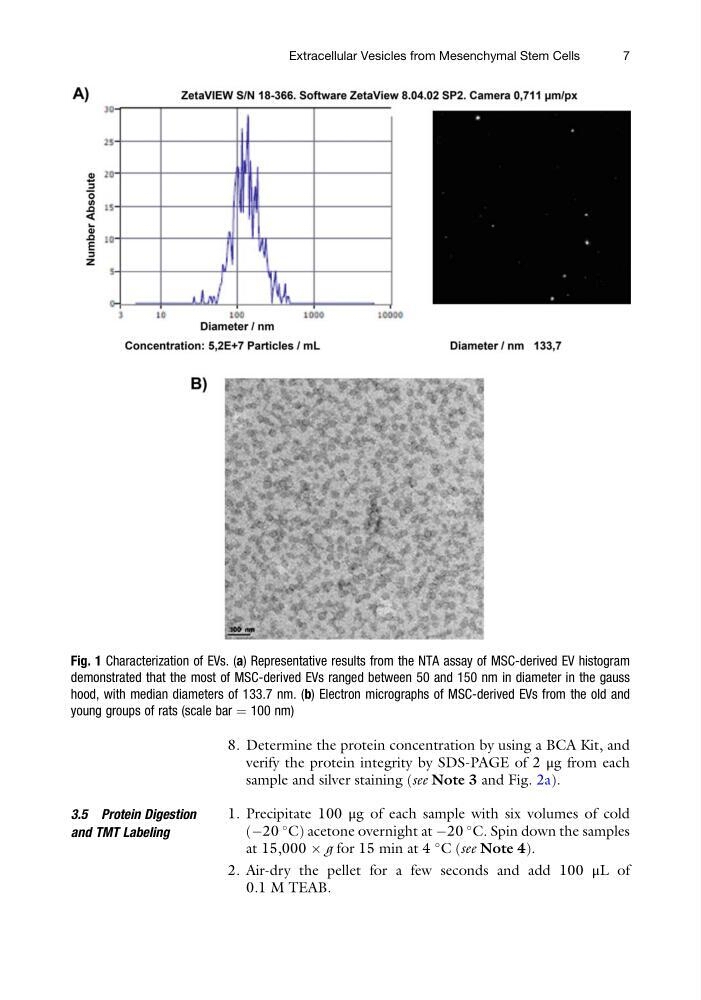
Fig. 1 Characterization of EVs. (a) Representative results from the NTA assay of MSC-derived EV histogram
demonstrated that the most of MSC-derived EVs ranged between 50 and 150 nm in diameter in the gauss
hood, with median diameters of 133.7 nm. (b) Electron micrographs of MSC-derived EVs from the old and
young groups of rats (scale bar ¼ 100 nm)
Extracellular Vesicles from Mesenchymal Stem Cells
7
verify the protein integrity by SDS-PAGE of 2 μg from each
sample and silver staining (see Note 3 and Fig. 2a).
3.5 Protein Digestion
and TMT Labeling
1. Precipitate 100 μg of each sample with six volumes of cold
(À20
C) acetone overnight at À20
C. Spin down the samples
at 15,000 Â g for 15 min at 4
C (see Note 4).
2. Air-dry the pellet for a few seconds and add 100 μL of
0.1 M TEAB.
Fig. 1 Characterization of EVs. (a) Representative results from the NTA assay of MSC-derived EV histogram
demonstrated that the most of MSC-derived EVs ranged between 50 and 150 nm in diameter in the gauss
hood, with median diameters of 133.7 nm. (b) Electron micrographs of MSC-derived EVs from the old and
young groups of rats (scale bar ¼ 100 nm)
Extracellular Vesicles from Mesenchymal Stem Cells
7