

catchments in the Eastern Cape was 2.4 times higher than the highest equivalent
estimate made elsewhere in South Africa at the time. The cost to clear the Berg River
catchment was estimated at ZAR 6 million in 1996 (2016 ZAR values; van Wilgen et al.
1997), but by 2016 the actual cost had reached ZAR 50 million (2016 ZAR values), 8.3
times the original estimate, without having reached a maintenance phase (Fill et al.
2017). Similarly, on privately-owned land at Vergelegen Estate, operations cost 3.6
times more than was originally estimated (ZAR 43.6 vs. 12.19 million respectively; van
Rensburg et al. 2017). Much of this problem can be attributed to regular unplanned
wildfires which necessitate large amounts of follow-up to clear seedlings that appear in
dense stands after wildfires. However, in some cases, the additional costs may well be
due to management inefficiencies. For example, McConnachie et al. (2012) found
significant inefficiencies in the Krom and Kouga catchments, in the form of inaccurate
records, where 25% of the areas recorded as having been cleared had in fact not been
cleared; and Kraaij et al. (2017) found that the quality of many treatments in the Garden
Route National Park was inadequate, with work done to standard in only 23% of the
assessed area. The prognosis for gaining control of alien plant invasions in the CFR’s
protected area network was investigated by van Wilgen et al. (2016). The study
concluded that, for scenarios in which control measures continued against all invasive
plant species, the estimated required funding to achieve the goal of reducing invasions
to a manageable level was up to 4.6 times greater than the amount spent over the past
20 years. Under many plausible future scenarios (for example 8% spread and current or
reduced funding) the invaded area would continue to grow.
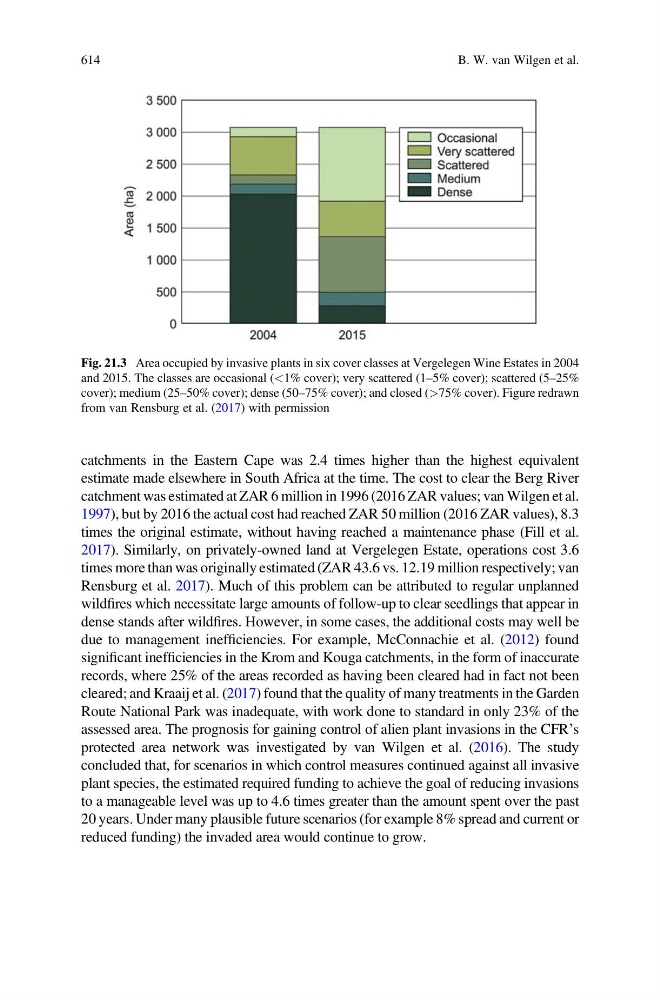
Fig. 21.3 Area occupied by invasive plants in six cover classes at Vergelegen Wine Estates in 2004
and 2015. The classes are occasional (<1% cover); very scattered (1–5% cover); scattered (5–25%
cover); medium (25–50% cover); dense (50–75% cover); and closed (>75% cover). Figure redrawn
from van Rensburg et al. (2017) with permission
614
B. W. van Wilgen et al.