

Box 19.2 Envisaging the Outcomes of Weed Biological Control
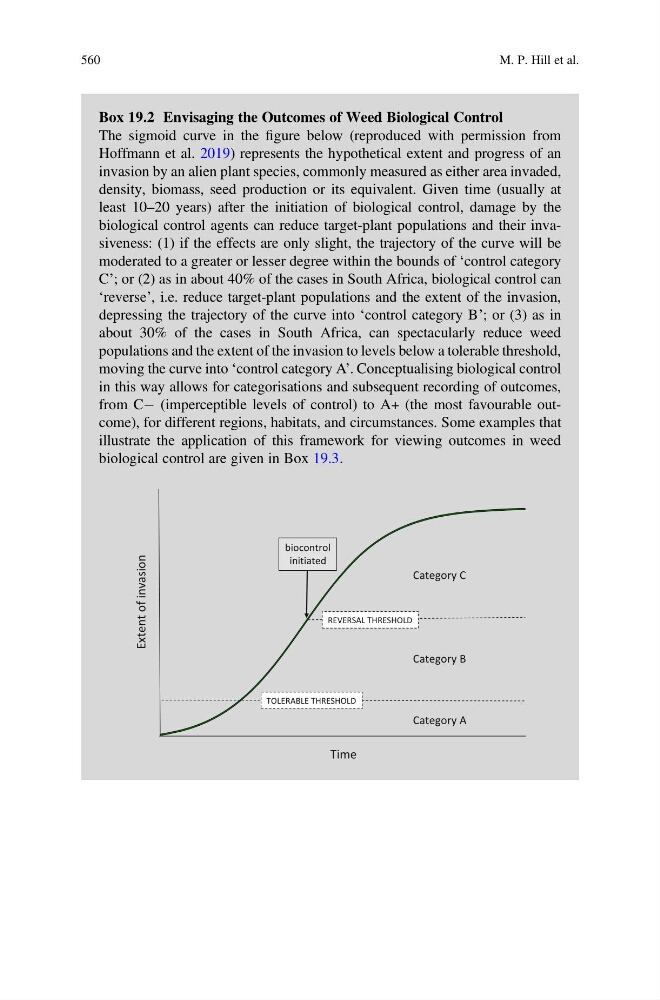
The sigmoid curve in the figure below (reproduced with permission from
Hoffmann et al. 2019) represents the hypothetical extent and progress of an
invasion by an alien plant species, commonly measured as either area invaded,
density, biomass, seed production or its equivalent. Given time (usually at
least 10–20 years) after the initiation of biological control, damage by the
biological control agents can reduce target-plant populations and their invasiveness: (1) if the effects are only slight, the trajectory of the curve will be
moderated to a greater or lesser degree within the bounds of ‘control category
C’; or (2) as in about 40% of the cases in South Africa, biological control can
‘reverse’, i.e. reduce target-plant populations and the extent of the invasion,
depressing the trajectory of the curve into ‘control category B’; or (3) as in
about 30% of the cases in South Africa, can spectacularly reduce weed
populations and the extent of the invasion to levels below a tolerable threshold,
moving the curve into ‘control category A’. Conceptualising biological control
in this way allows for categorisations and subsequent recording of outcomes,
from CÀ (imperceptible levels of control) to A+ (the most favourable outcome), for different regions, habitats, and circumstances. Some examples that
illustrate the application of this framework for viewing outcomes in weed
biological control are given in Box 19.3.
TOLERABLE THRESHOLD
REVERSAL THRESHOLD
biocontrol
initiated
Time
Category C
Category B
Category A
n
o
i
s
a
v
n
i
f
o
t
n
e
t
x
E
560
M. P. Hill et al.